
Check out this week’s Danger Zone interview with Chuck Jaffe of Money Life.
Investing in a company without thoroughly analyzing all of its 10-Ks and 10-Qs is like hiking in unfamiliar terrain without a map or GPS. Even if you’re physically fit, you’re putting yourself at unnecessary risk by not being as informed as you should be about the journey you’ve undertaken.
A new study from Alan Crane, Kevin Crotty, and Tarik Umar of Rice University shows just how important reading financial filings can be. The authors found that funds accessing SEC filings in a given month averaged 1.5% higher annualized returns than those that didn’t download any filings. Sadly, the study also found that some funds hardly ever download SEC filings.
Nevertheless, downloading filings is less than half the battle. The more important task for responsible investors is thoroughly analyzing all the information in the filings.
Investors deserve more diligence from fund managers, so we are putting those that don’t read SEC filings or lack the technology needed to thoroughly analyze those filings in the Danger Zone.
The Devil Is in The Details in Filings
SEC filings, especially 10-Ks and 10-Qs, contain huge amounts of valuable data, much of which is buried in the “fine print” or financial footnotes and management discussion and analysis (MD&A). Traditional data feeds, like Compustat, do not collect most of this buried information, and the data they do provide is often incomplete or incorrect. Consequently, any investment process that aims to fulfill the fiduciary duty of care requires thorough analysis of 10-Ks and 10-Qs by experts.
As we wrote in “AI Has a Big (Data) Problem”, the notion that dirty data can be “cleaned” is a fallacy. The only way to ensure data sets are accurate and complete is to collect directly from the source. Fund managers that rely on flawed third-party data feeds cannot get an accurate picture of a company’s profitability or stock’s valuation.
Figure 1 highlights how flawed data can give investors a misleading picture of corporate profitability. It shows that GAAP net income increased by 16% in 2017 even as economic earnings declined by 13%.
Figure 1: Economic Earnings and GAAP Net Income Since 2000
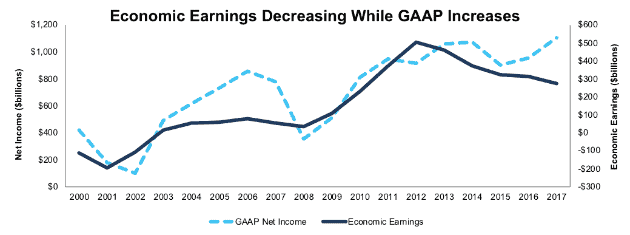
Sources: New Constructs, LLC and company filings
Increasing Complexity in Filings Makes the Job Nearly Impossible
While Crane, Crotty, and Umar found a performance advantage for funds that downloaded filings, this advantage declined significantly as the complexity of filings increased. This finding suggests that fund managers struggle to process the information buried in longer 10-Ks.
This problem continues to grow as corporate filings continue to increase in length and complexity. The amount of important data in these filings makes it impossible for any human to perform rigorous analysis for more than a small handful of companies.
The solution to this problem is the Robo-Analyst. Featured by Harvard Business School, the Robo-Analyst uses machine-learning technology to automate large portions of the research process. It can read through 200+ page filings in seconds, automatically collect routine data points and flag unusual items for human subject matter experts to review. Importantly, Robo-Analyst technology is built on the painstaking work of experts manually parsing 120,000 10-Ks and 10-Qs in a machine learning environment. It is not a black box of “fancy” algorithms that magically figure out how to interpret the data in filings.
Figure 2 shows the amount of work the Robo-Analyst performed during the recent 10-K filing season. From mid-February through March, it analyzed 2,013 filings and collected 286,576 data points. Our analyst team uses this data to make 46,201 forensic accounting adjustments to our valuation models with a dollar value of $17.8 trillion. The adjustments were applied as follows:
- 19,872 income statement adjustments with a total value of $1.3 trillion
- 18,732 balance sheet adjustments with a total value of $8.1 trillion
- 7,597 valuation adjustments with a total value of $8.3 trillion
Figure 2: Filing Season Diligence

Sources: New Constructs, LLC and company filings
We believe this research is necessary to fulfill the Fiduciary Duty of Care. Ernst & Young’s recent white paper, “Getting ROIC Right”, demonstrates how these adjustments contribute to meaningfully superior models and metrics.
The Dangers of Ignoring Complexity
The single most complicated filing we’ve analyzed so far in 2018 belonged to Pfizer (PFE). We made 63 different adjustments based on PFE’s 10-K with a total value of $296 billion.
We made 37 adjustments to the income statement alone with a dollar value of $23 billion (105% of GAAP net income). Our most significant adjustment was a $10.7 billion one-time gain due to the impact of tax reform.
While this adjustment is widely known, there were many other non-operating items that were more hidden. We made 14 adjustments based on pension data, which was buried on page 114. Due in part to its high expected return on plan assets of 8%, PFE earned $1 million from its pension plans in 2017 compared to spending $39 million in 2016.
When we account for all adjustments, we find that PFE’s after-tax operating profit (NOPAT) declined by 16% in 2017 even as reported GAAP net income nearly tripled.
The 18 balance sheet adjustments we made, which totaled $187 billion, showed that average invested capital increased by 5% in 2017. PFE’s return on invested capital (ROIC) decreased from 5% to 4% in 2017. Other data providers that don’t make these adjustments show PFE earning an ROIC of 45%.
Finally, we made 8 valuation adjustments with a dollar value of $86 billion. These adjustments deceased PFE’s valuation by $34 billion. Our largest adjustment was $48 billion in adjusted total debt, which includes $1.3 billion in off-balance sheet debt.
The declining profitability and significant liabilities revealed by our adjustments earn PFE our Unattractive rating.
The Next Step: Leveraging the Latest in Technology
The fact that funds can outperform just by downloading SEC filings, even if they struggle to process more complicated filings, suggests that many of their competitors are not taking advantage of all available resources. The study authors found that the average fund download amount was 672 per month, but the median was just 4, which means that half of all funds are barely downloading any SEC filings in a given month.
As a result, funds can thrive based solely on simple information signals. They don’t need to have a competitive advantage at processing data if their competitors aren’t even looking at the data in the first place. Figure 3 shows the top 5 funds by total SEC downloads, and the types of forms they’re downloading.
Figure 3: SEC Download Activity Since 2003
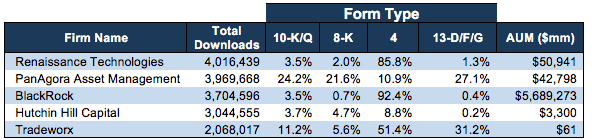
Sources: Crane, Crotty, and Rice
The type of filings being accessed further supports the idea that these funds are profiting off simple information signals. They are downloading a significant number of 10-Ks and 10-Qs – 3.5% of Renaissance Technologies 4 million downloads accounts for over 140 thousand filings – but they’re focused more on Form 4s (insider trades) and 13-D/F/Gs (institutional trades). These are simple data points that can be easily collected without the need for sophisticated technology.
Unfortunately for the funds in Figure 3, this advantage is unlikely to persist. Recent developments, such as the acquisition of research firm EVA Dimensions by proxy advisor ISS, show the increased demand for fundamental diligence. More and more investors are starting to take advantage of the available data. To stay ahead, the funds in Figure 3 need to improve their analysis of complex filings.
BlackRock (BLK) is already making an effort to improve its fundamental diligence through technology, as we wrote about last year in “Crossing the Chasm 2.0: Rise of the Robo Analyst.” The company transitioned $30 billion from actively managed funds into funds that rely on algorithms and models. CEO Larry Fink emphasized the need to leverage big data and analytics.
Crossing the Chasm 1.0 refers to Charles Schwab (SCHW) managers crossing the Golden Gate Bridge in 1999 to commemorate the company’s transition to an online brokerage. It represents the democratization of information that gave almost everyone the tools they need to invest.
Almost 20 years later, it’s remarkable how many fund managers are still relying on sentiment, technical analysis, and flawed third-party data feeds when all this information is at their fingertips. As these stragglers finally cross the first chasm, the next 20 years will be defined by those who cross the second chasm by using technology to better analyze the wealth of data available in corporate filings.
This article originally published on April 9, 2018.
Disclosure: David Trainer, Kyle Guske II, and Sam McBride receive no compensation to write about any specific stock, style, or theme.
Follow us on Twitter, Facebook, LinkedIn, and StockTwits for real-time alerts on all our research.
Click here to download a PDF of this report.
Photo Credit: Noelle Otto (Pexels)