
Check out this week’s Danger Zone interview with Chuck Jaffe of Money Life
It’s no secret that Wall Street research is conflicted. For a perfect example, look at the coverage of the Snap (SNAP: $15/share) IPO. Eleven of the twelve analysts who initiated coverage prior to the IPO rated SNAP “hold” or “sell.” Post IPO, nine of the underwriting banks issued “buy” ratings, four issued “hold” ratings and none issued “sell” ratings. One bank maintained its “buy” rating even after discovering an error in its math, only to lower its price target after the stock had already crashed.
These conflicts are not limited to IPOs. Sophisticated investors know “buy” ratings are mostly useless. CFO’s tell us that Wall Street analysts have no incentive to analyze a firm’s earnings quality.
Those blindly trusting Wall Street find themselves in the Danger Zone this week.
Underwriting Fees Create a SERIOUS Conflict of Interest
Investment banks make big fees by underwriting both equity and debt offerings. In 2013, Verizon (VZ) paid underwriters, including JPMorgan Chase (JPM) and Morgan Stanley (MS), $265 million in fees to underwrite its $49 billion bond sale.
According to data from Thomson Reuters, fees in recent years have averaged 1.2 percentage points for junk bonds and 0.7 percentage points for investment-grade bonds. In other words, on a $1 billion junk bond issuance, underwriters stand to make $12 million in fees alone.
It should come as no surprise that Wall Street would want to stay in good graces with those companies most likely to need debt (or equity) funding. They certainly do not want to be out of favor with clients. How do investment banks garner favor with corporate clients? Positive analyst coverage of course. For the latest example of conflicted research, look no further than Netflix (NFLX: $307/share).
Netflix: Do Analyst Really Love the Stock or Just the Underwriting Fees?
Netflix’s large cash burn can mean significant paydays for investment banks, many of whom also provide research on the stock. Morgan Stanley (MS), Goldman Sachs (GS), JPMorgan (JPM), Deutsche Bank (DB), and Wells Fargo (WFC) each give NFLX a Buy rating, and four of the five raised their price targets in the past month.
After reporting subscriber numbers in 1Q18 that beat expectations, Netflix did its largest capital raise to date, a $1.9 billion junk bond offering. Unsurprisingly, each of the five banks noted above played a role in this offering, according to Bloomberg.
This offering represents the eighth time Netflix has issued debt since 2011. 2011 was also the last year Netflix raised capital via equity. In these offerings, Netflix has raised more than $8.7 billion (7% of market cap), which include:
- $200 million in November 2011 – common stock sale
- $200 million in November 2011 – debt offering
- $500 million in January 2013 – debt offering
- $400 million in February 2014 – debt offering
- $1.5 billion in February 2015 – debt offering
- $1.0 billion in October 2016 – debt offering
- $1.4 billion in April 2017 – debt offering
- $1.6 billion in October 2017 – debt offering
- $1.9 billion in April 2018 – debt offering
In addition to the $8.5 billion of debt on its books, Netflix has another $4+ billion (3% of market cap) in outstanding employee stock option liabilities that further dilute value for existing shareholders.
Netflix’s cash burn doesn’t look to be coming to an end anytime soon, which is great news for investment banks. The company burned $2.8 billion in 2017 and had only $2.8 billion of cash left at the end of the year. Naturally, the bankers have been jockeying for a piece of the next offering for a while.
The last year Netflix generated positive free cash flow (FCF), was 2010, which coincides with the year it began significantly increasing its content library. Since then, Netflix has burned through a cumulative $9.3 billion in cash. This cash burn has persisted through multiple subscription price increases.
If history is any sign of things to come, Netflix’s next large debt offering could be coming in October of this year. Investors need to look past the positive coverage from Wall Street (which would love to underwrite the next securities offering) to uncover the real issues: rising costs, negative cash flows, and overvalued stock.
Ballooning Costs Will Require Additional Capital
Netflix’s rapidly rising costs drive the company’s cash burn. In 2017, streaming content obligations hit $17.7 billion, or 151% of total revenue. Content obligations have grown faster than revenue in four out of the past six years.
Figure 1: Widening Gap Between Content Obligations and NFLX’s Revenue
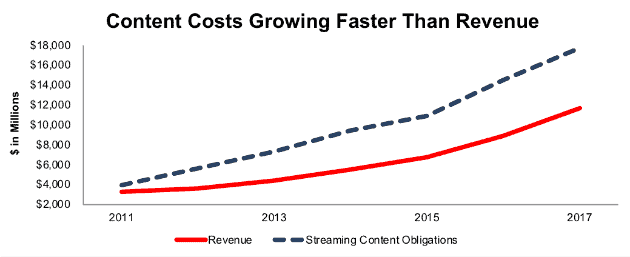
Sources: New Constructs, LLC and company filings.
It’s not just content spending that drives Netflix’s cash burn. The company has been significantly overpaying for talent as well, per a recent report from Bloomberg. Netflix has had to offer significant raises to lure employees away from established media companies. Examples:
- The average marketing salary at Netflix is $134 thousand, while the median marketing manager at Disney earns $73 thousand.
- The average customer service supervisor salary at Netflix is $63 thousand, while Comcast has a median salary of $48 thousand.
- The average executive assistant at Netflix is $98 thousand, while CBS has a median salary of $60 thousand.
In all three cases, the average Netflix salary is either at the very top or above the listed salary range for that position, relative to the competitor. All information on Netflix salaries comes from this article from Business Insider.
As a result of these high salaries, SG&A costs have been rising faster than revenue. Similar to content costs, SG&A has grown faster than revenue in four of the past six years. In 2017, SG&A grew by 37% while revenue grew by 32%.
In 2017, SG&A accounted for 18% of revenue at NFLX, compared to 16% for CBS and 15% for Disney.
Figure 2: SG&A & Revenue Growth Rate Since 2012
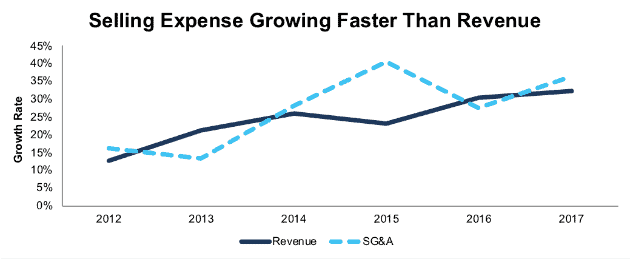
Sources: New Constructs, LLC and company filings.
The result of these ballooning costs has been negative free cash flow and mounting debt. Netflix’s debt rose from $4.1 billion in 2016 to $7.3 billion in 2017, not including the recent capital raise. As noted above, the company also had negative free cash flow of $2.8 billion in 2017.
NFLX Valuation Represents Biggest Investing Hurdle
For investors willing to ignore the large cash burn, rising costs, and senior debt offerings, Netflix’s valuation represents the biggest hurdle to investing in the stock. Despite what Wall Street research shows, our dynamic DCF model reveals Netflix is one of the most overvalued companies in the market. While Netflix may provide a great service to consumers, the company’s valuation makes little sense when compared to other content providers.
Netflix’s current market cap of $140 billion puts it extremely close to Disney (DIS) at $150 billion. For roughly the same price, would you rather own Netflix, with its $800 million in after-tax operating profit (NOPAT) and mishmash of content, or Disney’s $9.6 billion in NOPAT and content library that includes Marvel, Star Wars, animated classics from Pixar and Disney animation, and live sports rights from ESPN? We know which one we’d choose.
Even if Netflix can maintain TTM NOPAT margins (6%) and can grow NOPAT by 25% compounded annually for the next decade, the stock is worth only $112/share today – a 64% downside. See the math behind this dynamic DCF scenario here. This scenario assumes NFLX can grow revenue by consensus estimates in 2018 (36%) and 2019 (23%), and 23% each year thereafter.
Even in the Most Optimistic Scenarios, NFLX Remains Overvalued
To further illustrate just how overvalued NFLX is, we quantify three scenarios for the improvement in margins, subscribers, and/or revenue that is required to justify NFLX’s current price of $307/share. For reference, Netflix currently has just under 119 million paying subscribers, and there are ~250 million potential subscribers (people 18 and above) in the United States.
Scenario 1: If we assume that Netflix maintains its current price structure (despite increasing prices in recent years), its current pre-tax margins (8.3%), and can grow revenue by consensus estimates in EY1 & EY2 and by 39% thereafter (slightly above average of last five years), the company must grow NOPAT by 30% compounded annually for the next 13 years to justify its current price of $307/share.
In this scenario, Netflix would generate over $320 billion in revenue (13 years from now), which at current subscription prices implies the company would have 2.4 billion subscribers, or 32% of the global population. This scenario implies Netflix can grow subscribers by 26% compounded annually over the next 13 years. For reference, NFLX grew memberships 25% year-over-year in 2017, a rate that has declined from 30% year-over-year at the end of 2015. See the math behind this dynamic DCF scenario here.
Scenario 2: If we assume that Netflix adopts a strategy that improves margins by doubling prices at the expense of revenue growth, the current expectations are still overly optimistic. If Netflix can increase pre-tax margins to 16.6% (double current margin, higher than best ever 13.2% achieved in 2010), and grow revenue by 15% each year (compared to last five-year average of 27%), the company must grow NOPAT by 20% compounded annually for 22 years to justify its current price.
In this scenario, Netflix would be generating over $261 billion in revenue 22 years from now, which at double current subscription prices implies the company would have 993 million subscribers. This scenario implies Netflix can grow subscribers by 11% compounded annually over the next 22 years. Were Netflix to double prices it would likely see such a corresponding decline in membership growth. See the math behind this dynamic DCF scenario here.
Scenario 3: Even if we assume Netflix is able to drastically improve margins through price increases, but its original content helps maintain revenue growth, shares are still overvalued. If Netflix can achieve 16.6% pre-tax margins and grow revenue by 27% each year, the company must grow NOPAT by 38% compounded annually for the next 10 years to justify the current price.
In this scenario, Netflix would generate over $127 billion in revenue 10 years from now, which at double current subscription prices implies the company would have 484 million subscribers, or nearly quadruple its current user base. This scenario implies Netflix can grow subscribers 14% compounded annually over the next 10 years. See the math behind this dynamic DCF scenario here.
Each of these scenarios also assumes Netflix is able to grow revenue and NOPAT without spending on working capital or fixed assets, an assumption that is unlikely, given that Netflix plans to spend $8 billion on content in 2018 alone. However, using this assumption allows us to create unquestionably optimistic scenarios. For reference, NFLX’s invested capital has grown on average $2 billion (17% of 2017 revenue) per year over the last five years.
Figure 3 summarizes three potential scenarios for the profit growth needed to justify $307/share.
Figure 3: Valuation Scenarios for NFLX
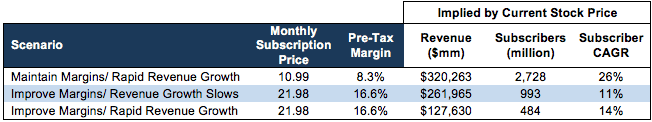
Sources: New Constructs, LLC and company filings.
Clearly, the current valuation of NFLX implies a future cash flow stream that even the strongest of business models would be challenged to achieve. Given the flaws in Netflix’s business, and the risk of further dilution through capital raises, holders of NFLX are taking imprudent risk with the stock at anywhere close to its current valuation.
You can see more of our past research on NFLX, which further details issues such as cash burn, competition, and valuation below.
- Danger Zone: 11/19/13: Netflix
- Netflix: Even More Dangerous
- The Ugly Truth About Netflix: Investors Beware
- The Spell is Broken: Netflix is More Like a Traditional TV Network
- Netflix’s Competitive Advantage Keeps Dwindling
- Netflix: Is the Music Slowing Down?
- Netflix: Look Past the Headline Beat
- Netflix’s Costly Business Model Proves Unsustainable
- Disney Dumps Netflix, and So Should Investors
- Netflix’s Price Increase Signals Original Content Isn’t Enough
Independent Research Offers Protection
While we highlighted Wall Street’s inherent conflict of interests at the beginning of this article, we also acknowledge that Wall Street can provide some of the best research in the world. The connections that many analysts can make with executives sometimes give them unique insight into companies, and they can offer valuable commentary on industry trends.
Unfortunately, one can never know which Wall Street reports are or are not conflicted since all the disclaimers in every report warn that each report may be conflicted in a myriad of ways. To combat these issues, independent due diligence can bring real value to one’s investing process. Investors deserve research that gets to the core drivers of valuation, and they deserve independent due diligence because it is part of fulfilling fiduciary duties.
Recent advances in technology[1] make it possible to deliver research at scale that is based on all available financial information, including items found in the footnote and MD&A. Those ignoring such technology and blindly following Wall Street research are doing a disservice to themselves, or their clients.
This article originally published on April 30, 2018.
Disclosure: David Trainer, Kyle Guske II, and Sam McBride receive no compensation to write about any specific stock, style, or theme.
Follow us on Twitter, Facebook, LinkedIn, and StockTwits for real-time alerts on all our research.
[1] Harvard Business School features the powerful impact of research automation technology in the case New Constructs: Disrupting Fundamental Analysis with Robo-Analysts.
Click here to download a PDF of this report.
Photo Credit: Wagner T. Cassimiro “Aranha” (Flickr)