
Check out this week’s Danger Zone interview with Chuck Jaffe of Money Life.
Our Danger Zone reports aim to identify firms that, despite more sanguine indications from traditional earnings[1] and noise traders, have struggling businesses and highly overvalued stock prices. These reports show investors how to use our research and display the transparency of our analytical process. However, we understand that at the end of the day, most investors care about one thing: performance.
It pays to read our Danger Zone reports. In 2019, 25 out of our 39 Danger Zone picks outperformed the market (S&P 500) as shorts. All in, the Danger Zone stocks, including reiterated ideas, averaged a 5% return in 2019 versus the S&P 500’s 11% gain[2], and outperformed as a short portfolio.
Last week, we examined our worst Danger Zone picks from 2019. This week, we’re taking some victory laps and looking at the blowups we successfully predicted last year. The IPO market, Rogers Corporation (ROG), and Cronos Group (CRON) are the Danger Zone highlights from 2019.
Highlight 1: The Bursting of the IPO Bubble: Down 36% vs. S&P up 15%
We put five different IPO’s in the Danger Zone in 2019. All of them underperformed the market, three declined by 25% or more, and one – WeWork – was such a fiasco that its IPO was called off and its valuation declined by 90% (from a reported $47 billion to just $4.9 billion) in a matter of weeks. Figure 1 shows the absolute and relative performance of these IPO’s – along with links to our articles – since they went public.
Figure 1: Performance of Danger Zone IPO’s in 2019
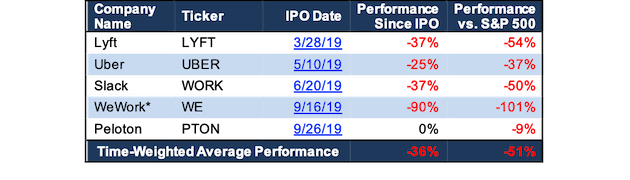
Sources: New Constructs, LLC and company filings
*WeWork performance based on the decline from initially reported $47 billion valuation in advance of its IPO being delayed on September 16 to the $4.9 billion valuation reported by SoftBank as of September 30.
These IPO’s shared similar qualities, such as:
- A history of significant cash losses
- Poor corporate governance
- Overblown valuations
In the past, investors haven’t seemed to care much about these issues. However, the poor performance of UBER and LYFT seemed to pique concern about unprofitable, overvalued IPO’s. The long history of self-dealing by WeWork’s CEO Adam Neumann raised awareness of the importance of corporate governance.
After WeWork’s IPO collapsed (which we like to think we played some role in making happen), the rest of the IPO market dried up. Talent agency Endeavor pulled its planned IPO, and Airbnb, which planned to go public in the fall of 2019, pushed back its IPO to 2020.
The caution from the public market seems to have spilled over into the private market as well. SoftBank’s Vision Fund, the largest VC fund in the world, recently called off planned investments in a number of major startups and says it will start putting a higher level of emphasis on rigorous diligence.
We’re happy to see more investors care about fundamentals and diligence, and we hope that readers took our advice to stay away from these risky IPO’s.
Highlight 2: Rogers Corporation (ROG) – first published April 29: Down 25% vs. S&P up 10%
We first made ROG a Danger Zone pick on April 29, 2019 in our article “Avoid These Overvalued Momentum Stocks.” At the time, ROG was up 72% on the year and had been the 2nd best performing stock in the S&P 500. We warned investors not to chase the momentum in ROG – or to take their gains if they already owned the stock.
Our analysis focused on the fact that ROG’s earnings growth was solely the product of overpriced acquisitions that boosted accounting earnings but hurt economic earnings, the real cash flows of the business. We also showed that ROG needed to grow after-tax profit (NOPAT) by 15% compounded annually for the next decade simply to justify its valuation.
When the market’s expectations are that high, any bit of bad news can lead to a significant decline in the stock price. Sure enough, the announcement of sanctions on key customer Huawei, along with a revenue decline in Q3, drove the stock down significantly over the rest of 2019. Figure 2 compares the performance of ROG to the S&P 500 since our article.
Figure 2: Stock Price Performance of ROG Vs. the S&P 500
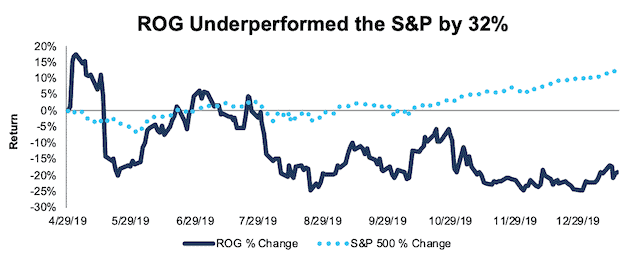
Sources: New Constructs, LLC and company filings
Despite this decline, ROG still has significant downside risk. If the company can maintain trailing-twelve-month (TTM) NOPAT margins of 11% and grow NOPAT by 7% compounded annually over the next decade (slightly below its 10% growth rate over the past five years), the stock is worth just $65/share today, a 51% downside to the current stock price. See the math behind this dynamic DCF scenario.
Highlight 3: Cronos Group (CRON) – first published October 8: Down 10% vs. S&P up 12%
Cannabis stocks received a lot of buzz in 2019, so we made a big push to cover them in the second half of the year. We first called out CRON as one of the riskiest stocks in the space on October 8, 2019 in our article “This Cannabis Stock Is Way Too High.”
While a 10% decline may not seem too significant, CRON’s return for most of the year was much worse. The stock was down 23% from our article to December 30, but it bounced on New Year’s Eve to minimize its year-end loss. So far in 2020, the stock initially declined 13%, only to rebound and get back up to even since our article, as shown in Figure 3.
Figure 3: Stock Price Performance of CRON Vs. the S&P 500
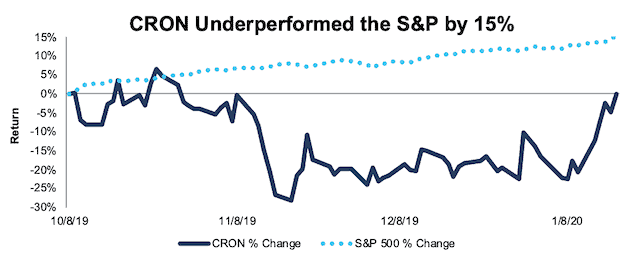
Sources: New Constructs, LLC and company filings
These wild swings show the risk and volatility inherent in the stock. Even compared to the rest of the cannabis industry, CRON looks especially dangerous due to a few key factors:
- Misleading Earnings: CRON’s GAAP net income grew to $1.1 billion over the TTM period, but these profits were entirely the result of non-operating gains on derivatives and other unusual items. The company’s NOPAT is still negative and declining.
- Competitive Disadvantages: CRON lacks the scale of many of its peers, both in terms of total revenues and production capacity. It also has the lowest invested capital turns of its peers, which means it is the least efficient at generating revenue from the capital it invests in its business.
- Expensive Valuation: Even after the stock price decline, CRON’s price/sales ratio of 88 is more than double its closest peers. CRON’s valuation implies it will be able to earn comparable margins to pharmaceutical companies, while we think the long-term margins in the industry will be closer to consumer food/beverage or tobacco companies.
Our reverse DCF model quantifies the high level of expectations embedded in CRON’s stock price.
To justify its valuation of $8/share, CRON must achieve 18% NOPAT margins (equal to the pharmaceutical industry average) and grow revenue by 63% compounded annually for the next decade (double the cannabis industry growth rate). See the math behind this dynamic DCF scenario.
It’s hard to believe that CRON can achieve pharmaceutical industry margins while achieving a growth rate that relies on mass recreational (not just medicinal) adoption.
If CRON grows revenue at the same rate as the above scenario for a decade but achieves 12% margins – equal to the consumer food and beverage industry average – the stock is worth $5/share today, a 33% downside to the current stock price. See the math behind this dynamic DCF scenario.
Given the volatility and hype in the cannabis industry, CRON’s valuation could become even more irrational, but we still think the risk/reward tradeoff in this stock is unfavorable for investors. The stock continues to earn our Very Unattractive rating.
This article originally published on January 21, 2020.
Disclosure: David Trainer, Kyle Guske II, and Sam McBride receive no compensation to write about any specific stock, sector or theme.
Follow us on Twitter, Facebook, LinkedIn, and StockTwits for real-time alerts on all our research.
[1] All of our reports utilize the superior data and earnings adjustments featured by the HBS & MIT Sloan paper, "Core Earnings: New Data and Evidence.”
[2] The S&P 500 gained 29% in 2019, but since our picks are published over the course of the year we measure performance against the S&P 500 at the publication dates, not the beginning of the year.