We closed the ROG position on November 16, 2020. A copy of the associated Position Update report is here.
Check out this week’s Danger Zone interview with Chuck Jaffe of Money Life.
As the market reaches record levels despite no real profit growth, diligence matters more than ever. Irrational exuberance can drive stocks to dangerously high levels in the short-term. If you own momentum stocks with poor fundamentals, your portfolio could take big hits when fickle noise traders suddenly decide to sell.
These stocks are some of the best performing so far in 2019, but they have misleading earnings and significant downside risk. Carvana Co. (CVNA: $67/share) and Rogers Corporation (ROG: $171/share) are in the Danger Zone.
Stock Valuations Don’t Only Go Up
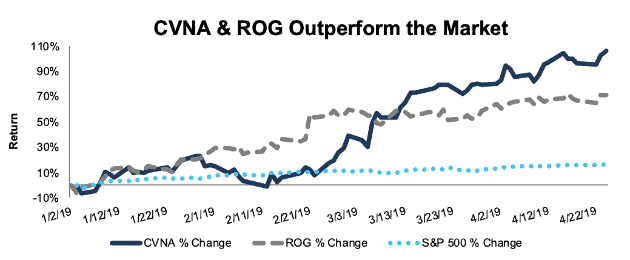
Per Figure 1, CVNA and ROG are up 106% and 72% year-to-date (YTD) respectively, which greatly outpaces the 17% YTD return of the S&P 500. However, the fundamentals of their businesses remain weak and do not justify their valuations.
Figure 1: Outperformance Makes These Stocks More Overvalued

Sources: New Constructs, LLC and company filings
The momentum that investors are chasing could end soon. In “Big Tech Still Dominates Economic Earnings Growth”, we showed that despite reported profit growth, economic earnings declined across the market in 2018 after removing the impact of tax cuts. Artificially elevated earnings cannot support overvalued stocks indefinitely.
When the music stops for momentum stocks, the results can be devastating. Look no further than the fourth quarter of 2018, when CVNA and ROG were down 43% and 30% respectively, compared to a 14% decline in the S&P 500. Investors would be wise to take their gains (or avoid entering at these high levels) before the next downturn in these momentum stocks.
Carvana Co. (CVNA): Unattractive Rating
Carvana aims to simplify the car buying experience by allows consumers to view, analyze, and purchase a car directly from their computer or mobile device. While a great proposition for consumers, the business model is not so great at creating shareholder value.
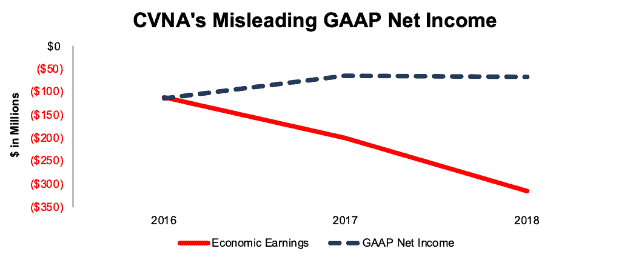
Misleading Earnings: From 2016-2018, CVNA’s GAAP net income improved from -$114 million to -$67 million. Meanwhile, economic earnings, the true cash flows of the business, fell from -$112 million to -$315 million, per Figure 2.
Figure 2: CVNA’s Misleading GAAP Net Income Hides Falling Economic Earnings

Sources: New Constructs, LLC and company filings.
This disconnect between GAAP net income and economic earnings is partially attributed to a net $155 million in non-operating income that artificially improves CVNA’s GAAP net loss. We add back $193 million in reported losses attributable to non-controlling interests. Due to Carvana’s status as a holding company, it is able to remove these losses and, therefore, improve its reported bottom line. Only by adding this loss back to economic earnings can we calculate the true operating profits of the business, regardless of the company’s corporate structure.
Economic earnings also account for changes to the balance sheet, from which we made the following adjustments:
- $109 million (17% of reported net assets) in off-balance sheet operating leases
- $2 million (<1% of reported net assets) in asset write-downs
By adding these items back to invested capital, we hold CVNA accountable for all capital invested in the business. These adjustments, when combined with a rising weighted average cost of capital (11.2% in 2018, up from 9.8% in 2016), increase the capital charge and decrease economic earnings.
In addition to negative and declining economic earnings, Carvana faces significant competition and has yet to prove its online-centric business model can lead to sustained profitability in a highly fragmented market. Of the 19 auto vehicles, parts, and services retailers under coverage, only Carvana has negative NOPAT margins and return on invested capital (ROIC). Despite the issues, CVNA is priced as if it will immediately achieve profitability, but also garner a significantly greater share of the market.
Shares Are Now Overvalued: We’re not alone when we point out how overvalued CVNA is – the stock is one of the most shorted stocks in the market. When we use our reverse DCF model to quantify the future cash flow expectations baked into the current stock price, we’re not sure anyone can make a straight-faced argument for owning CVNA.
To justify its current price of $67/share, CVNA must immediately achieve 8% NOPAT margins (vs. -11% in 2018) and grow revenue by 20% compounded annually for the next 15 years. See the math behind this dynamic DCF scenario. For reference, CarMax (KMX) earned a 5% NOPAT margin in 2018. In this scenario, Carvana would generate over $27 billion in revenue 13 years from now, compared to CarMax’s $18 billion in revenue in 2018.
In other words, simply to justify the current stock price, one must believe Carvana can instantly become more profitable and generate more revenue than the current largest used car dealership in the United States (CarMax).
Even if Carvana can leverage its online-platform to achieve 6% NOPAT margins (slightly higher than CarMax), and grow revenue by 25% compounded annually, the stock is worth just $43/share today – a 36% downside.
Each of these scenarios also assumes CVNA is able to grow revenue, NOPAT and FCF without increasing working capital or fixed assets. This assumption is unlikely but allows us to create best-case scenarios that demonstrate how high expectations embedded in the current valuation are. For reference, CVNA’s invested capital has grown on average $276 million (14% of 2018 revenue) each year over the past three years.
Rogers Corporation (ROG): Very Unattractive Rating
Rogers Corporation, an electronic materials/components provider, has completed numerous acquisitions in recent years that, on the surface, appear accretive. However, when we do proper diligence on the earnings, we find that the company’s fundamentals are headed the opposite direction of reported results and cannot justify the stock’s lofty valuation.
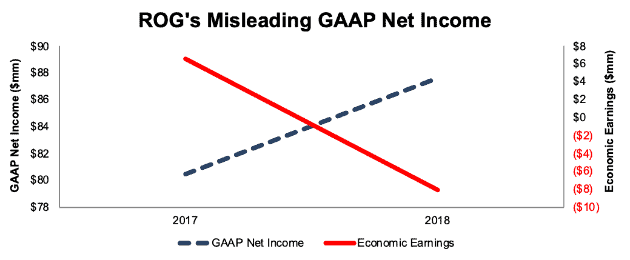
Misleading Earnings: In 2018, GAAP net income grew 8% YoY, from $80 million to $88 million, while economic earnings fell from $7 million to -$8 million, per Figure 3.
Figure 3: ROG’s GAAP Net Income Rises While Economic Earnings Fall

Sources: New Constructs, LLC and company filings.
In its 10-K, we found non-recurring items that both increase and decrease reported profits, such as $3 million in other income on the income statement and $1 million in transaction costs found on page 52. While the net impact of all these items was <$1 million, we do the diligence required to find and adjust for these items for all companies we cover so our clients can trust the consistency and rigor of our models.
We also added the following adjustments to ROG’s balance sheet:
- $78 million (7% of reported net assets) in accumulated other comprehensive loss
- $76 million (6% of reported net assets) in accumulated asset write-downs
- $10 million (1% of reported net assets) in operating leases
By including these items in invested capital, we hold ROG accountable for all capital invested in the business. These adjustments, when combined with a rising weighted average cost of capital (8.7% in 2018, up from 8.4% in 2017), increase the capital charge and decrease economic earnings.
The company’s numerous acquisitions over the past five years have failed to create shareholder value. Since 2014, ROG has spent over $430 million on acquisitions (36% of 2018 invested capital). These acquisitions have helped NOPAT grow 9% compounded annually over the past five years. Unfortunately for shareholders, ROG’s invested capital has grown 17% compounded annually over the same time. ROG’s balance sheet growing faster than profits drove its ROIC, the real driver of shareholder value, down from 10% in 2014 to its current 8%.
Shares Are Overvalued: After rising 72% in the first few months of 2019, it should come as no surprise that ROG is significantly overvalued. The surprising part is just how high expectations for future cash flows are.
To justify its current price of $171/share, ROG must achieve 15% NOPAT margins (higher than the company record of 11% achieved in 2017 and 2006) and grow NOPAT by 15% compounded annually for the next decade. See the math behind this dynamic DCF scenario. These expectations seem overly optimistic for a firm that is expected to grow EPS by only 6% next year.
Even if ROG can achieve its peak 11% NOPAT margins (compared to 10% in 2018) and grow NOPAT by 7% compounded annually for the next decade, the stock is worth just $87/share today – a 49% downside. See the math behind this dynamic DCF scenario.
As with CVNA above, each of these scenarios also assumes ROG is able to grow revenue, NOPAT and FCF without increasing working capital or fixed assets. This assumption is unlikely but allows us to create best-case scenarios that demonstrate how high expectations embedded in the current valuation are. For reference, ROG’s invested capital has grown on average $116 million (13% of 2018 revenue) each year over the past five years.
This article originally published on April 29, 2019.
Disclosure: David Trainer, Sam McBride and Kyle Guske II receive no compensation to write about any specific stock, sector, style, or theme.
Follow us on Twitter, Facebook, LinkedIn, and StockTwits for real-time alerts on all our research.
