
We closed the TDOC Danger Zone pick on November 16, 2020. A copy of the associated Position Update report is here.
Check out this week’s Danger Zone interview with Chuck Jaffe of Money Life.
Our Danger Zone reports aim to identify firms that, despite more sanguine indications from traditional earnings[1] and noise traders, have struggling businesses and highly overvalued stock prices. These reports show investors how to use our research and display the transparency of our analytical process. However, we understand that at the end of the day, investors care about one thing: performance.
It pays to read our Danger Zone reports. In 2019, 25 out of our 39 Danger Zone picks outperformed the market (S&P 500) as shorts. All in, the Danger Zone stocks, including reiterated ideas, averaged a 5% return in 2019 versus the S&P 500’s 11% gain,[2] and outperformed as a short portfolio.
Next week, we’ll release our best Danger Zone picks from 2019, but this week we’re starting out the year by looking at where we went wrong and what we can learn from our worst-performing Danger Zone picks (as we recently did with our Long Ideas from 2019). Tesla (TSLA), Brooks Automation (BRKS), and Teladoc (TDOC) are the Danger Zone lowlights from 2019. Despite their recent momentum, we remain bearish on these stocks, and they all remain open Danger Zone picks.
Lowlight 1: Tesla (TSLA) – Full Year Performance: Up 25% vs. S&P 500 up 29% - Reiterated July 29: Up 77% vs. S&P up 7%
We’ve been bearish on Tesla since August of 2013. The stock price went against us for a long time, but over the first half of 2019 it appeared the market was finally beginning to agree with us. The stock dropped over 40% by the beginning of June due to production shortfalls and mounting cash losses. These issues led us to title our July 29 article “More Broken Promises from Tesla”.
Since that article, the stock has rocketed upward on the back of a profitable earnings report and the promise of the 2020 launch of the Model Y. Even an awkward debut of the Cybertruck – in which the supposedly bulletproof windows shattered – couldn’t halt the momentum.
The stock surged to hit the infamous $420 level – the price at which Elon Musk supposedly planned to take the company private in 2018 – by the end of the year. The stock is up another 15% already in 2020, and its $87 billion market cap is now larger than Ford (F) and General Motors (GM) combined.
Figure 1 shows that TSLA’s $480/share valuation implies it will grow after-tax operating profit (NOPAT) by 50% compounded annually over the next 15 years and earn more than six times the profits of GM at that point.
Figure 1: Tesla Vs. General Motors: Historical and Implied NOPAT
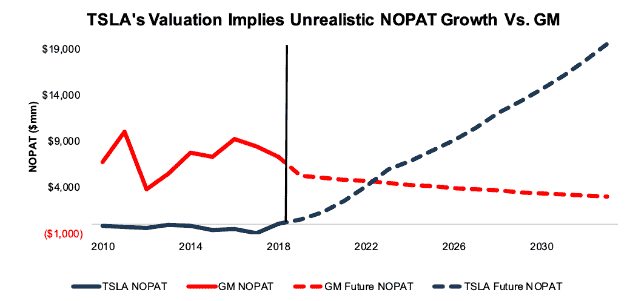
Sources: New Constructs, LLC and company filings
Tesla exceeded our expectations by achieving profitability, but the company still has a long way to go to prove it can maintain profitability or come anywhere close to achieving the profit expectations embedded in its market cap. Its trailing twelve months (TTM) return on invested capital (ROIC) is just 1%, compared to a cost of capital (WACC) of 8%. The company needs to increase its profits eightfold in order to avoid destroying shareholder value, and it needs to do much more than that to justify the market’s valuation.
Meanwhile, Tesla’s revenue declined by 8% in the most recent quarter, and its profitability has come from cutting back on R&D and capex. Given these cuts, it’s hard to see how the company hits its ambitious targets for new vehicle production and self-driving capabilities. Despite the rally in the stock, we don’t see a real change in the fundamental risks in owning Tesla stock. That said, the cars themselves are a good deal for consumers since investors are subsidizing the company’s ability to sell them below cost.
Lowlight 2: Brooks Automation (BRKS) – first published February 5: Up 34% vs. S&P up 18%
We first put BRKS in the Danger Zone in our February 5, 2019 article “Three Misleadingly Cheap Stocks.” At the time, we said the stock’s falling P/E ratio misled investors due to $49 million in non-operating income from discontinued operations that artificially increased reported earnings.
In 2019, the company continued to benefit from discontinued operations, this time disclosing $428 million in non-operating income. As a result of this non-operating income, GAAP earnings rose again, from $117 million in 2018 to $437 million in 2019, rather than falling as we predicted.
BRKS just goes to show that earnings can always get more distorted in the short-term, which can make shorting any stock difficult. Still, these non-operating items can’t last forever, and the fundamentals of BRKS remain poor. It has an ROIC of just 3%, and -$363 million (12% of market cap) in free cash flow over the past year. It’s economic earnings, which strip out non-operating items and account for the balance sheet, fell from -$125 million in 2018 to -$162 million in 2019. Figure 2 shows the disconnect between GAAP and economic earnings for 2019.
Figure 2: BRKS GAAP Net Income and Economic Earnings: 2018-2019
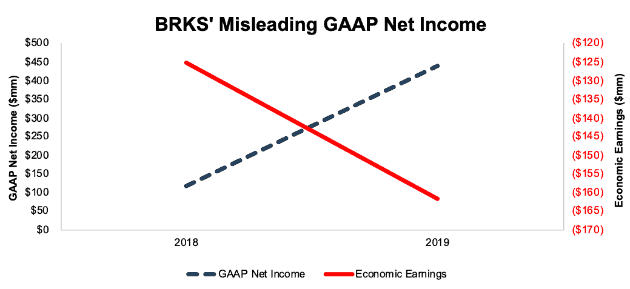
Sources: New Constructs, LLC and company filings
In addition, the company delayed its 10-K filing in December due to issues with revenue recognition, and its auditor disclosed the company had a material weakness in its internal controls over financial reporting.
These accounting issues add another risk factor to an already risky and overvalued stock.
Lowlight 3: Teladoc (TDOC) – first published March 18: Up 33% vs. S&P up 14%
We first put TDOC in the Danger Zone in our March 18, 2019 article “Danger Zone: Incentivizing Executives with Adjusted EBITDA.” Investors should try to avoid companies that tie executive compensation to Adjusted EBITDA – a metric that is easy to manipulate and has no clear link to shareholder value.
Despite the flaws of Adjusted EBITDA, investors still seem to be buying the company line for TDOC. Adjusted EBITDA more than doubled, from $8 million through the first three quarters of 2018, to $17 million through the first three quarters of 2019. The stock outperformed the market and gained 33%, in turn.
On the other hand, net operating profit after tax (NOPAT) continues to decline, from -$64 million in 2018 to -$74 million TTM. The disconnect largely comes from TDOC excluding real expenses like stock compensation expense (which increased by $17 million year-over-year in 2019) from Adjusted EBITDA. By excluding real expenses, TDOC maintains the illusion of profitability. Figure 3 shows the disconnect between NOPAT and Adjusted EBITDA.
Figure 3: TDOC NOPAT vs. Adjusted EBITDA: 2018-TTM
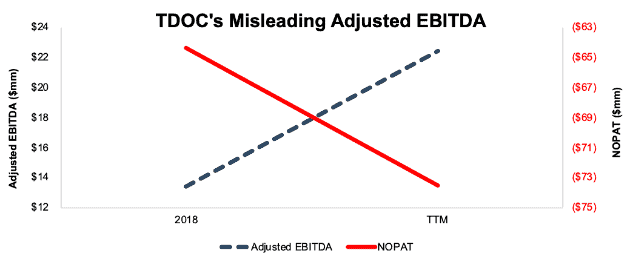
Sources: New Constructs, LLC and company filings
Investors have already learned not to trust phony metrics from high-flying IPO’s like WeWork. It’s only a matter of time until they turn that same skepticism towards already-public companies like TDOC.
This article originally published on January 13, 2020.
Disclosure: David Trainer, Kyle Guske II, and Sam McBride receive no compensation to write about any specific stock, sector, style, or theme.
Follow us on Twitter, Facebook, LinkedIn, and StockTwits for real-time alerts on all our research.
[1] All of our reports utilize the superior data and earnings adjustments featured by the HBS & MIT Sloan paper, "Core Earnings: New Data and Evidence.”
[2] The S&P 500 gained 29% in 2019, but since our picks are published over the course of the year we measure performance of our picks against the S&P 500 at the publication dates, not the beginning of the year.