
To demonstrate the difference our proprietary Adjusted Fundamental data makes, we continue our series of reports that show how our Credit Ratings are more reliable than legacy firms’ ratings. This report explains how our “Adjusted” Debt to Capital ratio is better than the “Traditional” ratio because the Traditional ratio is based on unscrubbed financial data. Debt to Capital is one of the 5 ratios that drives our Credit Ratings. Get explanations and comparisons for the other four metrics here.
No Bias, More Coverage, and Better Analytics: A New Paradigm for Credit Ratings
Though legacy providers, e.g. Moody’s, S&P, and Fitch, have dominated the credit ratings industry for some time, our Credit Ratings offer these advantages:
- more coverage: ~2,700 companies vs. ~1,500 for S&P
- more frequent updates: we update all ~2,700 of our credit ratings quarterly while S&P updates ratings for ~400 companies per year
- free of conflicts of interest that continue to taint legacy ratings.
Most importantly, superior fundamental data drives material differences in our Credit Ratings and research compared to legacy firms’ research and ratings. This report will show how Debt to Capital ratings for 8% of S&P 500 companies are misleading because they rely on unscrubbed data.
We also detail the differences that better data makes at the aggregate[1], i.e. S&P 500[2], level and the individual company level (see Appendix) so readers can easily quantify the benefits of our superior data.
Unscrubbed Debt Is Understated by -7% for the S&P 500
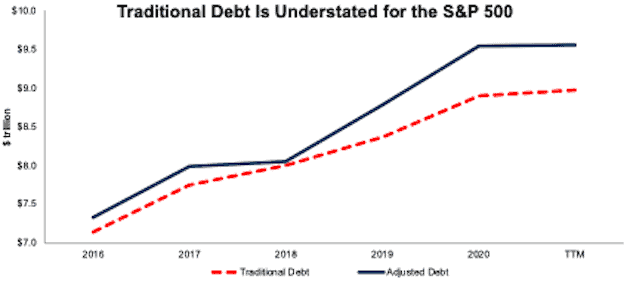
We use Debt as the numerator for the Debt to Capital ratio. Figure 1 shows the difference between Traditional Debt and our Adjusted Debt since 2016. Over the trailing twelve months (TTM), Traditional Debt understates our Adjusted Debt by -$586 million, or -7% of Traditional Debt.
Figure 1: Traditional Vs. Adjusted Debt for S&P 500
Sources: New Constructs, LLC and company filings.
Adjusted Debt provides a more complete view of the fair value of a firm’s total short-term, long-term, and off-balance sheet debt.
Traditional Capital Is Understated by Just -1% for the S&P 500
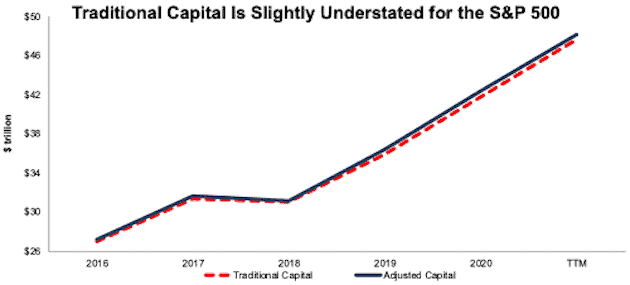
We use capital as the denominator for the Debt to Capital ratio. The difference between Traditional and Adjusted Capital are driven by adjustments to Debt. Over the TTM, Traditional Capital is understated by -$586 billion, or -1% of Traditional Capital.
Figure 2: Traditional Vs. Adjusted Capital for S&P 500
Sources: New Constructs, LLC and company filings.
Traditional Debt to Capital Ratio Is Understated by -5% at the Aggregate Level
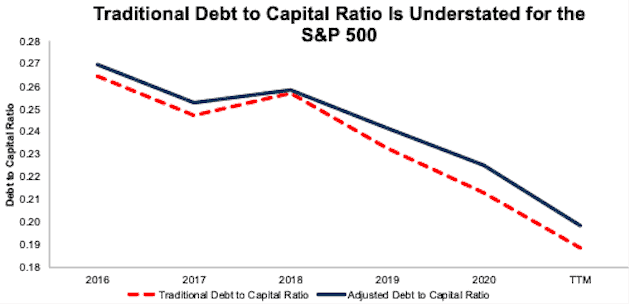
At the aggregate level, differences between Traditional and Adjusted Debt drive the difference between the Traditional and Adjusted Debt to Capital ratios. Figure 3 shows that the Traditional Debt to Capital ratio has been understated since 2016. Over the TTM, the Traditional Debt to Capital ratio of 0.20 is higher than the Adjusted Debt to Capital ratio of 0.19 and is understated by -5%.
Figure 3: Traditional Vs. Adjusted Debt to Capital Ratio for S&P 500
Sources: New Constructs, LLC and company filings.
Even Bigger Differences Emerge at the Individual Company Level
When analyzing individual companies, we see very large differences in Traditional and Adjusted Debt, Traditional and Adjusted Capital, and Traditional and Adjusted Debt to Capital ratios. For example, even though there is just a 1% difference between Traditional and Adjusted Capital at the aggregate level, at the company level, we find Traditional Capital understated by as much as 30% and overstated by as much as 24%. Eight percent of the firms in the S&P 500 have Traditional Capital that is over/understated by 5% or more.
Figure 4 shows the number of S&P 500 companies with understated and overstated Debt to Capital ratios. Companies with negative Debt to Capital Ratio distortion[3] are understated and those with positive Debt to Capital distortion are overstated.
About 78% of S&P 500 companies’ Traditional Debt to Capital ratios are overstated and 20% are understated.
Figure 4: Number of S&P Companies with Under/Overstated Debt to Capital Ratios: TTM

Sources: New Constructs, LLC and company filings.
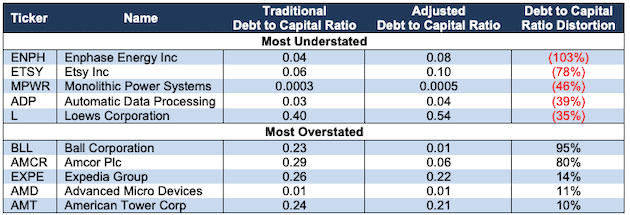
Figure 5 lists ten S&P 500 companies with the most understated and overstated Debt to Capital ratios, by Debt to Capital Ratio distortion, over the TTM.
Note: we detail the data and disclosures that drive the differences in Traditional versus Adjusted Debt and Capital for Advanced Micro Devices (AMD) and Expedia Group (EXPE) in the Appendix to this report.
Figure 5: Companies with Under/Overstated Debt to Capital Ratios: TTM
Sources: New Constructs, LLC and company filings.
Ratings Based on Traditional Ratios Are Misleading
Not surprisingly, differences between Traditional and Adjusted ratios drive differences in the Credit Ratings we derive for Debt to Capital.
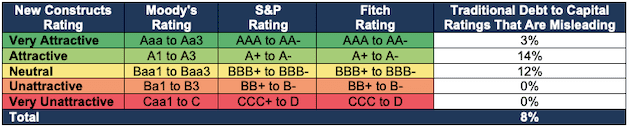
Figure 6 shows how our Credit Ratings align with legacy firms’ ratings systems and the percentage of Traditional Debt to Capital ratings that are different from ratings based on Adjusted ratios for companies in the S&P 500. Overall, 8% of the Traditional Debt to Capital ratings are different from our Adjusted Debt to Capital rating because they rely on unscrubbed data.
As we explain in our Credit Ratings methodology, we set the Debt to Capital ratio thresholds so that the distribution of our ratings is comparable to the distribution of ratings for legacy firms. We use the Traditional version of the Debt to Capital ratio to set thresholds so that the difference in our ratings comes from the difference in our data.
Figure 6: S&P 500: Percent of Traditional Debt to Capital Ratings That Are Misleading
Sources: New Constructs, LLC and company filings.
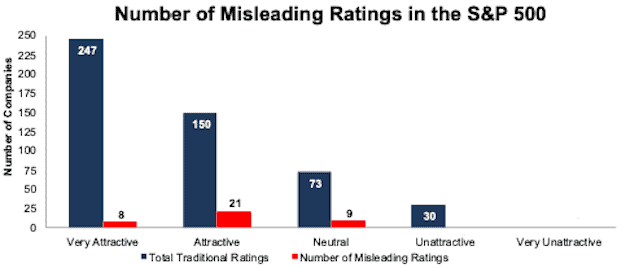
Figure 7 provides more details on the number of companies whose Traditional Debt to Capital ratings are different from the rating based on Adjusted Debt to Capital ratios.
For example, 21 out of 150 (14%) companies that earn an Attractive Debt to Capital rating based on the Traditional ratio earn a different rating based on the Adjusted ratio.
Figure 7: S&P 500: Number of Misleading Traditional Debt to Capital Ratings
Sources: New Constructs, LLC and company filings.
We dedicate the Appendix of this report to showing readers exactly how our Adjusted values for Debt and Capital are different and better than the unscrubbed versions.
This article originally published on June 30, 2021.
Disclosure: David Trainer, Kyle Guske II, Alex Sword, and Matt Shuler receive no compensation to write about any specific stock, style, or theme.
Follow us on Twitter, Facebook, LinkedIn, and StockTwits for real-time alerts on all our research.
Appendix: Auditing the Differences in Traditional Vs. Adjusted Values
This Appendix will show exactly how our Adjusted values for Debt and Capital differ from the Traditional versions for Automatic Data Processing and Expedia.
Automatic Data Processing: The Difference in Traditional Vs. Adjusted Values
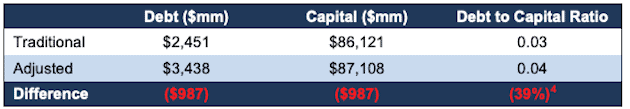
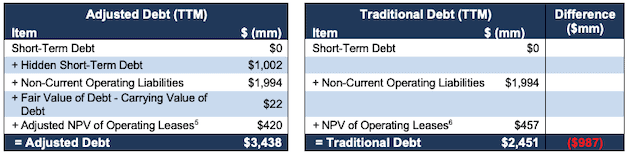
Figure 8 shows the differences between the two components of the Debt to Capital ratio, Debt and Capital for Automatic Data Processing. The difference between Automatic Data Processing’s Traditional Debt and Adjusted Debt is -$987 million, or -40% of Traditional Debt. The difference between Traditional Capital and Adjusted Capital is -1% of Traditional Capital and is entirely driven by the difference between Traditional and Adjusted Debt.
Figure 8: Automatic Data Processing: Traditional Vs. Adjusted Debt to Capital Components
Sources: New Constructs, LLC and company filings.
Reconciling Automatic Data Processing’s Traditional and Adjusted Debt
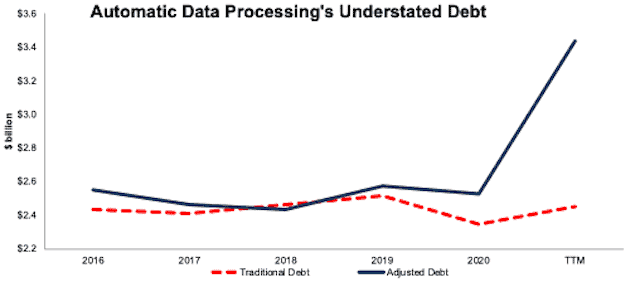
Automatic Data Processing’s understated Debt drives its understated Debt to Capital ratio. Figure 9 shows the firm’s Traditional and Adjusted Debt since 2016.
Figure 9: Automatic Data Processing: Traditional Vs. Adjusted Debt: 2016-TTM
Sources: New Constructs, LLC and company filings.
The -$987 million difference between Automatic Data Processing’s Traditional Debt and Adjusted Debt is driven by:
- $1 billion in hidden short-term debt
- $22 million difference between the fair value of debt and the carrying value of debt
- $37 million difference between reported NPV of operating leases and Adjusted NPV of operating leases
Figure 10 reconciles Automatic Data Processing’s Traditional Debt and Adjusted Debt and details each of the adjustments listed above.
Figure 10: Automatic Data Processing: Adjusted Vs. Traditional Debt Detailed Comparison
Sources: New Constructs, LLC and company filings.
Reconciling Automatic Data Processing’s Traditional and Adjusted Capital
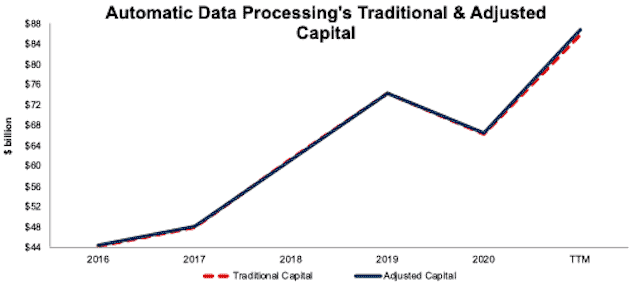
Figure 11 shows Automatic Data Processing’s Traditional Capital and Adjusted Capital since 2016 have been nearly identical.
Figure 11: Automatic Data Processing: Traditional Vs. Adjusted Capital: 2016-TTM
Sources: New Constructs, LLC and company filings.
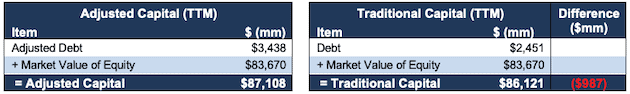
Figure 12 reconciles Automatic Data Processing’s Traditional and Adjusted Capital and shows that the difference between Traditional and Adjusted Debt drives all of the difference between Traditional and Adjusted Capital.
Figure 12: Automatic Data Processing: Adjusted Vs. Traditional Capital Detailed Comparison
Sources: New Constructs, LLC and company filings.
Automatic Data Processing‘s Debt to Capital Ratio Is Understated
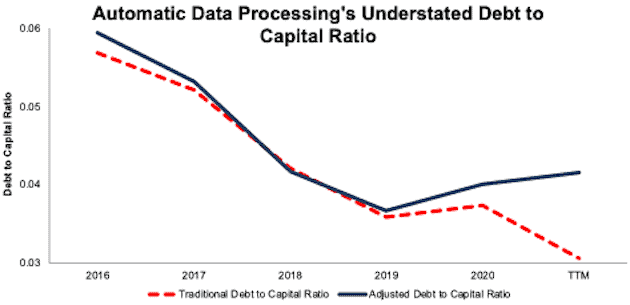
With large understated Traditional Debt and slightly understated Traditional Capital, Automatic Data Processing’s Debt to Capital ratio is one of the most understated of all companies in the S&P 500. Per Figure 13, Automatic Data Processing’s Debt to Capital ratio has grown increasingly understated since 2019.
Figure 13: Automatic Data Processing: Traditional Vs. Adjusted Debt to Capital Ratio: 2016-TTM
Sources: New Constructs, LLC and company filings.
Expedia: The Difference in Traditional Vs. Adjusted Values
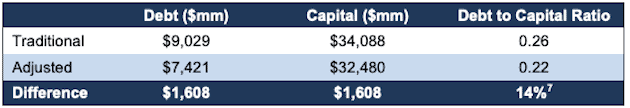
Figure 14 shows the differences between the two components of the Debt to Capital ratio, Debt and Capital for Expedia. The difference between Expedia’s Traditional Debt and Adjusted Debt is $1.6 billion, or 18% of Traditional Debt. The difference between Traditional Capital and Adjusted Capital is 5% of Traditional Capital and is entirely driven by the difference between Traditional and Adjusted Debt.
Figure 14: Expedia: Traditional Vs. Adjusted Debt to Capital Components
Sources: New Constructs, LLC and company filings.
Reconciling Expedia’s Traditional and Adjusted Debt
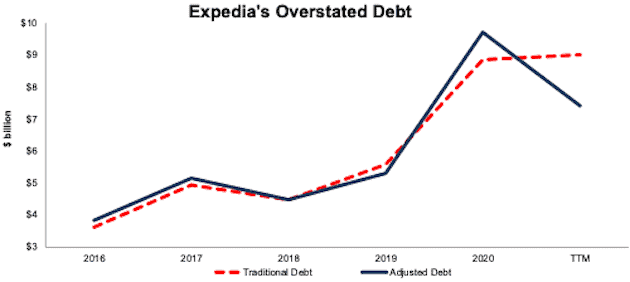
The primary driver of Expedia’s overstated Debt to Capital ratio is overstated Debt. Figure 15 shows the firm’s Traditional Debt has moved from being understated to overstated over the TTM.
Figure 15: Expedia: Traditional Vs. Adjusted Debt: 2016-TTM
Sources: New Constructs, LLC and company filings.
The $1.6 billion difference between Expedia’s Traditional Debt and Adjusted Debt is driven by:
- $1.7 billion difference between the fair value of debt and the carrying value of debt
- -$56 million difference between reported NPV of operating leases and Adjusted NPV of operating leases
Figure 16 reconciles Expedia’s Traditional Debt and Adjusted Debt and details each of the adjustments listed above.
Figure 16: Expedia: Adjusted Vs. Traditional Debt Detailed Comparison

Sources: New Constructs, LLC and company filings.
Reconciling Expedia’s Traditional and Adjusted Capital
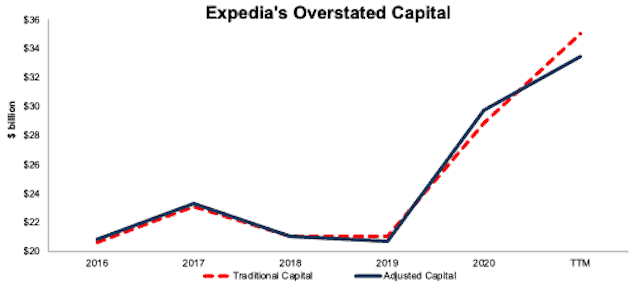
Figure 17 compares Expedia’s Traditional Capital and Adjusted Capital since 2016.
Figure 17: Expedia: Traditional Vs. Adjusted Capital: 2016-TTM
Sources: New Constructs, LLC and company filings.
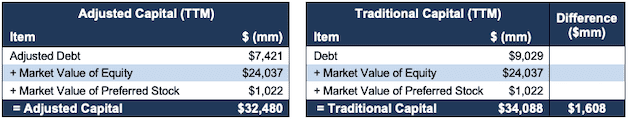
Figure 18 reconciles Expedia’s Traditional and Adjusted Capital and shows that the difference between Traditional and Adjusted Debt accounts for all the difference between Traditional and Adjusted Capital.
Figure 18: Expedia: Adjusted Vs. Traditional Capital Detailed Comparison
Sources: New Constructs, LLC and company filings.
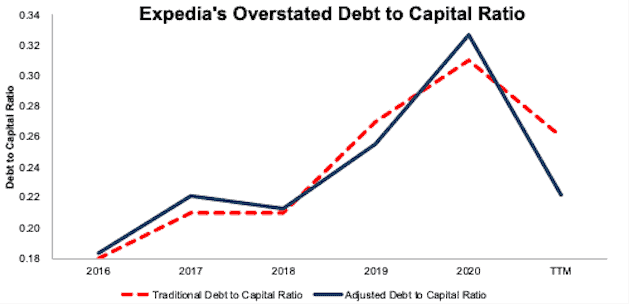
Expedia’s Debt to Capital Ratio Is Overstated
With overstated Traditional Debt and Traditional Capital, Expedia’s Debt to Capital is one of the most overstated of all companies in the S&P 500. Per Figure 19, Expedia’s Debt to Capital has moved from understated to overstated over the TTM.
Figure 19: Expedia: Traditional Vs. Adjusted Debt to Capital Ratio: 2016-TTM
Sources: New Constructs, LLC and company filings.
[1] We calculate the S&P 500 Traditional and Adjusted EBITDA by aggregating the results for all current members of the S&P 500.
[2] In this analysis, we use the 494 companies for which we have data back to 2016 and are currently in the S&P 500.
[3] Debt to Capital Ratio Distortion equals (Traditional Debt to Capital ratio - Adjusted Debt to Capital ratio) / Traditional Debt to Capital ratio.
[4] This number is the Debt to Capital Ratio Distortion, which equals (Traditional Debt to Capital ratio - Adjusted Debt to Capital ratio) / Traditional Debt to Capital ratio.
[5] We use a standardized discount rate across all companies under coverage to calculate the Adjusted NPV of Operating Leases to ensure comparability and remove management discretion in calculating operating lease liabilities. Find more details on how we treat operating leases here.
[6] Traditional NPV of Operating Leases equals the operating lease obligation reported in the firm’s 2Q20 10-Q.
[7] This number is the Debt to Capital Ratio Distortion, which equals (Traditional Debt to Capital ratio - Adjusted Debt to Capital ratio) / Traditional Debt to Capital ratio.
[8] We use a standardized discount rate across all companies under coverage to calculate the Adjusted NPV of Operating Leases to ensure comparability and remove management discretion in calculating operating lease liabilities. Find more details on how we treat operating leases here.
[9] Traditional NPV of Operating Leases equals the operating lease obligation reported in the firm’s 2Q20 10-Q.