
We published an update on this Long Idea on April 21, 2021. A copy of the associated Earnings Update report is here.
Not often do investors get an opportunity to invest in a global leader at an attractive valuation. However, the expectations baked into this firm’s stock price seem overly pessimistic and create significant upside potential. Add in consistent profit growth and a strong executive compensation plan and it becomes clear why this stock could be an excellent portfolio addition. PepsiCo Inc. (PEP: $112/share) is this week’s Long Idea.
PEP’s Consistent Profit Growth
PEP has grown revenue 6% compounded annually over the past decade. Over the same period, after-tax profit (NOPAT) has increased 5% compounded annually, per Figure 1. Consistent profit growth has been fueled by a consistent NOPAT margin, which has averaged 13% over the last decade and equals 13% over the last twelve months. Longer-term, PEP has grown NOPAT by 7% compounded annually since 1998.
Figure 1: PEP Profit Growth Since 2000
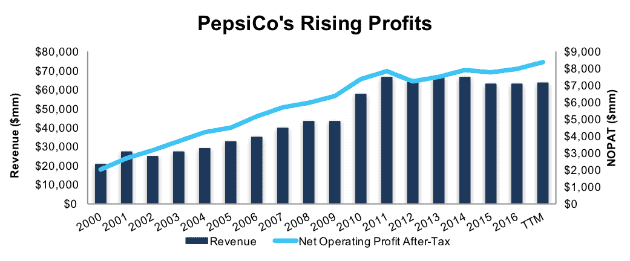
Sources: New Constructs, LLC and company filings
PEP has generated a cumulative $43 billion (68% of market cap) of free cash flow (FCF) over the past five years. PEP’s $7.7 billion in FCF over the last twelve months equates to a 4% FCF yield compared to 2% for the average S&P 500 stock.
PEP has also exhibited good stewardship of capital by consistently generating an ROIC above its weighted average cost of capital (WACC). PEP has earned a double digit return on invested capital (ROIC) in 16 of the past 17 years. PEP currently earns an 11% ROIC, which is in the second-quintile of our coverage universe.
PEP’s consistent balance sheet efficiency is further evidence of good capital stewardship. PEP’s invested capital turns (revenue/average invested capital) have averaged 0.84 over the past five years and currently stand at 0.8 (TTM).
Executive Compensation Plan Is Directly Aligned with Creating Shareholder
PEP’s executive compensation plan signals that management understands the importance of properly aligning executives’ interests with shareholders’ interests. PEP’s annual incentives are tied to numerous business performance metrics including revenue, EPS, net income, and more. Most importantly, CEO Indra Nooyi’s annual incentive award is tied to ROIC improvement. Additionally, long-term awards are split between performance shares and long-term cash awards. 50% of long-term cash awards are tied to the 3-year cumulative increase in ROIC. PEP notes that ROIC is a “key metric that aligns with our financial goals communicated to shareholders to improve both capital spending and working capital management, enabling us to continue to improve the efficiency of our asset base.”
The focus on ROIC helps ensure executives continue to be good stewards of capital. Per Figure 2, PEP has earned a double-digit ROIC in 16 of the last 17 years. ROIC peaked at 14% in 2007 and bottomed at 9% in 2012. Since then, ROIC has improved from 9% in 2012 to 11% TTM. PEP has grown economic earnings from $2.2 billion in 2006 to $5.1 billion TTM. PEP’s use of ROIC to measure performance also earns it a spot on September’s Exec Comp Aligned with ROIC Model Portfolio.
Figure 2: PepsiCo’s Exec Comp Plan Drives Rising ROIC
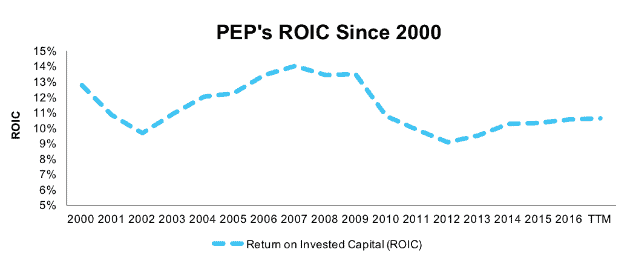
Sources: New Constructs, LLC and company filings
Improving ROIC Correlated with Creating Shareholder Value
We know from Figure 3 below, and numerous case studies, that changes in stock prices are strongly correlated to ROIC. As such, getting ROIC right is an important part of the investment decision making process. A recent white paper published by accounting firm, Ernst & Young shows material superiority of our forensic accounting research and measure of ROIC versus the largest research providers.
Per Figure 3, ROIC explains 83% of the changes in valuation for the 42 Food & Beverage peers under coverage. Despite PEP’s 11% ROIC, slightly above the 10% average of the peer group, the firm’s stock trades at a discount to peers as shown by its position below the trend line in Figure 3. If the stock were to trade at parity with its peers, it would be $180/share – 61% above the current stock price. Given the firm’s rising ROIC, shareholder-aligned exec comp plan, and consistent profit growth, one would think the stock would garner a premium valuation.
Figure 3: ROIC Explains 83% Of Valuation for Food & Beverage Stocks
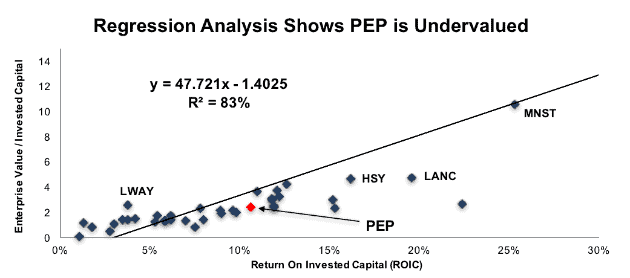
Sources: New Constructs, LLC and company filings
PEP’s Profitability Provides Lasting Advantage
PEP’s revenue is broken into Food (52% in 2016) and beverage (48% in 2016) and is split between U.S (58% in 2016) and Outside U.S. (42% in 2016. The firm is home to key brands such as Frito Lay (Lay’s, Doritos, Tostitos, Ruffles, Cheetos), Quaker Foods (Quaker oatmeal, Aunt Jemima, Cap’n Crunch), Pepsi soft drinks (Mountain Dew, Pepsi, Mug), and Gatorade. In total, PepsiCo has a portfolio of 22 brands that generate over $1 billion in sales. The firm is focused on building these global brands to maintain market share while maximizing efficiency to grow profits.
PEP’s ability to continually improve its margins represents a strong competitive advantage in a market filled with competition. Competitors include The Coca-Cola Company (KO), Monster Beverage Corp (MNST), Mondelez International (MDLZ), Lance Inc. (LNCE), and Kellogg Company (K), among others. Figure 4 shows the average NOPAT margin for PEP’s peers. PEP’s 13% TTM NOPAT margins ranks above the peer group average and has increased five consecutive years.
Figure 4: PepsiCo’s Profitability Higher Than Peer Average
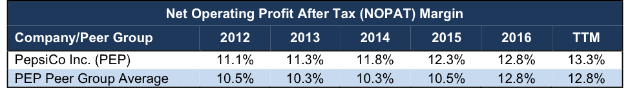
Peer Group Constituents: CCE, DPS, FIZZ, K, KO, LNCE, MDLZ, SODA, MNST, GIS
Sources: New Constructs, LLC and company filings.
These high margins provide insulation from adverse operating conditions, especially global uncertainty or fluctuating currency exchange rates. At the same time, PEP is able to continue investing in new products or brands while maintaining profitability, in large part due to the large cash flow provided by its business lines.
Bears Ignore More Profitable Shift to Food Products
Many will argue that PepsiCo has reached a point where it is so large that continued profit growth will be difficult to achieve. However, these arguments ignore PepsiCo’s ability to transition its business to meet consumer demands all while continually growing profits over the past decade.
In 2010, 51% of PepsiCo’s revenue was derived from its beverage segment. Over the past few years, consumers (and regulators) have taken steps to cut back on the high-sugar sodas and drinks that fill PepsiCo’s product lineup. Over this time, the business shifted more heavily towards Food products, which as noted above, made up 52% of revenue in 2016. With this shift came an increased focus on healthy products (both beverage and food), but also a shift into higher margin segments of PepsiCo’s business. Frito Lay and Quaker Foods segments had operating margins of 30% and 25% respectively in 2016. Compare this performance to the 14% operating margin of North American Beverage segment or the 10% operating margin of the Asia, Middle East, and North Africa segments, and it’s clear to see expanding PepsiCo’s food business is the key to future profit growth.
To that end, PepsiCo has continually developed new food products such as Organic Tostitos, Quaker Breakfast Flats, and the entire “Everyday Nutrition” lineup which will not only boost margins, but also meet the “healthy food” trend that has taken place in recent years. In fact, PepsiCo notes that in 2016, the Pepsi-Cola brand accounted for 12% of net revenue while “Everyday Nutrition” products accounted for 25% of net revenue. Despite the name, PepsiCo has moved well beyond just a soda firm and has positioned itself for future profit growth.
The shift to food and, in particular healthy food, comes at the perfect time as well. Euromonitor estimates healthy snack sales will rise by 3% compounded annually through 2021, compared to 2% growth in traditional snacks. Furthermore, Europe and North America, areas PepsiCo already has a large presence, will drive the growth in healthy snacks.
In addition to underappreciating the growth potential of more profitable segments, the bear case is further weakened by analyzing PEP’s valuation. The stock’s current valuation ignores PEP’s years of profit growth and significantly undervalues its business, as we’ll show below.
Despite Price Appreciation, PEP Remains Undervalued
PEP is up 58% over the past five years but has underperformed the S&P 500, which is up 71% over the same time. Despite rising 7% year-to-date, the disconnect between the fundamentals of the business and PEP’s valuation presents a buying opportunity.
At its current price of $112/share, PEP has a price-to-economic book value (PEBV) ratio of 1.0. This ratio means the market expects no meaningful growth in PEP’s NOPAT over the remaining life of the firm. This expectation seems overly pessimistic for a firm that has grown NOPAT by 7% compounded annually since 1998 and was the top contributor to U.S. Food & Beverage retail sales growth in 2016.
If PEP can maintain 2016 NOPAT margins (13%) and grow NOPAT by just 3% compounded annually for the next decade, the stock is worth $139/share today – a 24% upside. This scenario assumes PEP can grow revenue by consensus estimates in the current year (1%) and next year (4%), and 3% each year thereafter.
Add in the potential 6% yield detailed below, and it’s clear why PEP could be a great portfolio addition.
Share Repurchases Plus Dividends Could Yield Over 6%
PEP repurchased $3 billion of stock in 2016 and $967 million through the first six months of 2017. These repurchases fall under its current $12 billion authorization which expires at the end of June 2018. $6.4 billion remained under the current authorization at the end of 2Q17. PEP management expects to repurchase $2 billion in stock during 2017. A repurchase of this size equates to 3.2% of the current market cap. When combined with the 2.9% dividend yield, the total yield to shareholders could approach 6.1%.
Apart from a quality repurchase authorization, PEP has a long history of returning capital to shareholders. PEP is part of a select group of companies (commonly referred to as Dividend Aristocrats) and has increased its dividend for 45 consecutive years. Its current annual dividend of $3.22/share equates to 9% compound annual growth over the past five years. Dividend growth has been enabled by PEP’s free cash flow. Per Figure 5, PEP generated cumulative FCF of $34 billion (54% of market cap) and paid out cumulative dividends of $15.4 billion from 2013-2016. Over the last twelve months, PEP has generated $7.7 billion in FCF and paid out $4.3 billion in dividends. This Impressive dividend growth also earned PEP a spot on August’s Dividend Growth Stocks Model Portfolio.
Figure 5: Free Cash Flow vs. Dividends Since 2013
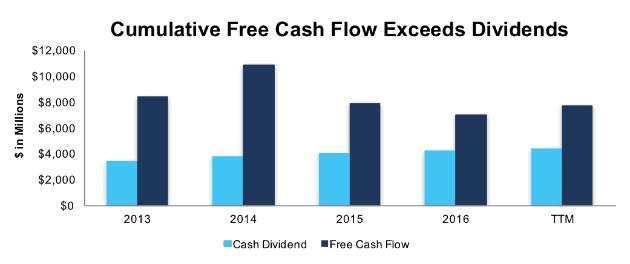
Sources: New Constructs, LLC and company filings
Earnings Surprise Could Boost Shares
Despite PEP’s impressive TTM performance (improving margin, rising NOPAT), earnings expectations (as defined by “consensus EPS”) have fallen from $5.72 to $5.58 over the past year. Over the same period, NOPAT (TTM) is up 10% and quarterly earnings have exceeded expectations each of the last four quarters.
Falling expectations in the face of rising profits creates a situation where an upside surprise sends the shares significantly higher. PEP remains poised for additional upside surprises given the growth potential of its higher-margin product lines and targeted costs savings through productivity enhancements. In the meantime, investors carry low valuation risk and are rewarded with a potential 6% total shareholder yield.
Insider Trading and Short Interest Trends
There is little insight to be gained from recent insider trading trends. Insider activity has been minimal over the past 12 months with 1.4 million shares sold and 441,000 shares purchased for a net effect of 968,000 shares sold. These shares sold represent less than 1% of shares outstanding.
Short interest trends are more insightful. There are currently 7.6 million shares sold short equating to less than 1% of shares outstanding and 2.5 days to cover. Short interest has fallen from 11 million shares at the end of September 2016 as investors have recognized the strength in PEP’s fundamentals.
Auditable Impact of Footnotes & Forensic Accounting Adjustments
Our Robo-Analyst technology enables us to perform forensic accounting with scale and provide the research needed to fulfill fiduciary duties. In order to derive the true recurring cash flows, an accurate invested capital, and an accurate shareholder value, we made the following adjustments to PepsiCo’s 2016 10-K:
Income Statement: we made $4.6 billion of adjustments, with a net effect of removing $1.7 billion in non-operating expense (3% of revenue). We removed $1.5 billion in non-operating income and $3.1 billion in non-operating expenses. You can see all the adjustments made to PEP’s income statement here.
Balance Sheet: we made $55.3 billion of adjustments to calculate invested capital with a net increase of $22.8 billion. The most notable adjustment was $14.2 billion in other comprehensive income. This adjustment represented 27% of reported net assets. You can see all the adjustments made to PEP’s balance sheet here.
Valuation: we made $62.9 billion of adjustments with a net effect of decreasing shareholder value by $34.9 billion. Apart from $41 billion total debt, which includes $1.5 billion in off-balance sheet operating leases, the largest adjustment was $14 billion in excess cash. This cash adjustment represents 22% of PEP’s market cap. Despite the net decrease in shareholder value, PEP remains undervalued.
Attractive Funds That Hold PEP
The following funds receive our Attractive-or-better rating and allocate significantly to PEP.
- Fidelity MSCI Consumer Staples Index ETF (FSTA) – 8.3% allocation and Very Attractive rating.
- iShares US Consumer Goods ETF (IYK) – 7.5% allocation and Very Attractive rating.
- Vanguard Consumer Staples Index Fund (VCSAX) – 7.4% allocation and Very Attractive rating.
- AMG Yacktman Focused Fund (YAFIX) – 7.0% allocation and Very Attractive rating.
- YCG Enhanced Fund (YCGEX) – 6.9% allocation and Very Attractive rating.
This article originally published on September 27, 2017.
Disclosure: David Trainer, Kyle Guske II, and Kenneth James receive no compensation to write about any specific stock, style, or theme.
Follow us on Twitter, Facebook, LinkedIn, and StockTwits for real-time alerts on all our research.
Click here to download a PDF of this report.
Photo Credit: Lukas (Pexels)
1 Response to "Dividend Growth Stock with Strong Corporate Governance Trading at a Discount"
Comment removed at user’s request.