We closed OMC on September 19, 2024. A copy of the associated Position Close report is here.
We closed PEP on June 23, 2023. A copy of the associated Position Close report is here.
We published an update on JPM on May 4, 2022. A copy of the associated Earnings Update report is here.
We’re reiterating three Long Ideas that recently reported calendar 1Q21 earnings: JPMorgan Chase & Company (JPM:$149/share), PepsiCo Inc. (PEP: $146/share), and Omnicom Group, Inc. (OMC: $79/share).
Still Undervalued
Figure 1 shows the performance of the three Long Ideas featured in this report. We leverage more reliable fundamental data, proven in The Journal of Financial Economics[1], with qualitative research to highlight these firms whose stocks present excellent risk/reward.
Figure 1: Long Idea Performance: From Date of Publication Through 4/20/2021
Sources: New Constructs, LLC
*Measured from the date of publication of each respective original report. Dates can be seen in each company section below. Performance represents price performance and is not adjusted for dividends.
JPMorgan Chase & Company: Safe, Steady and Cheap
We made JPMorgan Chase a Long Idea in May 2020 and identified it as the fintech micro-bubble winner in March 2021. Here’s what we learned from the 1Q21 earnings report and why we still like this stock.
What’s Working: JPMorgan Chase is well-positioned in what CEO Jamie Dimon calls an “economy with the potential to have extremely robust, multi-year growth.” While rising interest rates might slow economic growth and hurt capital markets’ cash flows, they would drive JPMorgan’s net interest margins higher.
JPMorgan beat on both the top and bottom line in its 1Q21 earnings. Additionally, JPMorgan’s 1Q21 results show that it is more than capable of capitalizing on volatile markets, with equity markets revenue up 47% year-over-year (YoY) and investment banking fees up 57% YoY.
Spending from JPMorgan Chase’s debit and credit cards reached pre-pandemic levels in the quarter and is up 14% compared to 1Q19. The firm’s release of $5.2 billion in loan loss reserves suggests strong credit quality across its loan portfolio.
With $123.9 billion in free cash flow (FCF) from 2016 to 2020, JPMorgan Chase is significantly more profitable than its peers Well Fargo (WFC), Bank of America (BAC), and Goldman Sachs (GS) and easily repurchased $75 billion (16% of market cap) worth of shares. Should the firm repurchase the $7.4 billion in shares (max capacity as of 2Q21) before the end of the year, investors could see a yield of 4.9% from buybacks alone in 2021 at JPM’s current price.
The firm’s strong performance throughout the pandemic and in 1Q21 in particular affirms our original thesis that the firm would be an integral part of the economic recovery from the pandemic.
What’s Not Working: With the Fed ending its temporary exemption of treasuries and deposits in its measure of capital requirements, as measured by the supplementary leverage ratio[2] (SLR), JPMorgan Chase may soon need to take action that could lower its ROE and free cash flow.
The firm’s average deposits have swelled to $2.2 trillion in 1Q21 and are 36% higher than 1Q20. Increased deposits drive its SLR lower from 6.8% in 4Q20 to just 5.5% in 1Q21. To maintain the Fed’s requirement of an SLR of 5% or greater going forward, JPMorgan Chase may be forced to turn away deposits or issue new debt. While it may seem counterintuitive for a bank to turn away deposits, JPMorgan has done it before. In its 4Q20 earnings call, JPMorgan made clear the two levers it has in dealing with SLR when Jennifer Piepszak, the firm’s CFO, said, “We could simply shy away from taking new deposits, redirecting them elsewhere in the system or we can issue or retain additional capital and pass on some of that cost, which is certainly something we wouldn’t want to do in this environment.”
Jennifer Piepszak indicated the bank is already turning away deposits which could have long-term detrimental effects on JPMorgan Chase’s relationships with its customers and negatively impact its profitability when she stated during the 1Q21 earnings call, “…we’re working closely with wholesale clients in a very selective way, as I mentioned, to find alternatives for excess deposits.” As management noted in the firm’s 1Q21 earnings call, “raising capital against deposits and/or turning away deposits are unnatural actions for banks and cannot be good for the system in the long run.” It is important to note that the Fed is seeking comment on “measures to adjust the SLR.”
Current Price Looks Really Cheap: Below, we use our reverse discounted cash flow (DCF) model to analyze the expectations for future growth in cash flows baked into the current stock price.
In this scenario, we assume JPMorgan Chase’s:
- NOPAT margin falls to 26% (five-year average vs. 31% TTM) in 2021 and each year thereafter, and
- revenue falls by 2% compounded annually from 2021-2030 (vs. consensus estimate CAGR of +1% from 2021-2023)
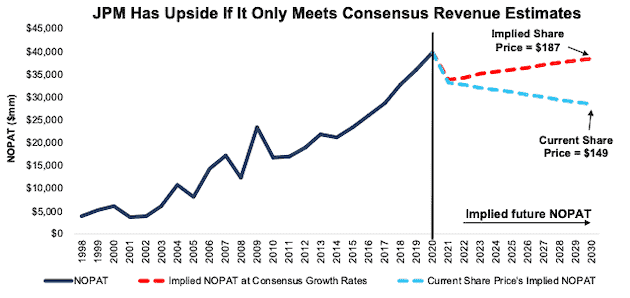
In this scenario, JPMorgan Chase’s net operating profit after-tax (NOPAT) falls by 3% compounded annually over the next decade and the stock is worth $149/share today – equal to the current price. See the math behind this reverse DCF scenario. For reference, JPMorgan Chase grew NOPAT by 11% compounded annually over the past decade.
At $187/share, There’s Still Lots of Upside: If we assume JPMorgan Chase’s margin falls to 26% and the firm grows revenue by 1% compounded annually from 2021-2030 (in line with consensus revenue growth estimates for 2021-2023), the stock is worth $186/share today, or 22% above the current price. See the math behind this reverse DCF scenario.
In this scenario, JPMorgan Chase’s NOPAT falls by less than 1% compounded annually over the next decade and it’s 2030 NOPAT is still 3% below 2020 levels. Should profits rise even quicker, as they have in the past, JPM would provide even greater upside.
Figure 2: JPMorgan Chase’s Historical and Implied NOPAT: DCF Valuation Scenarios
Sources: New Constructs, LLC and company filings
PepsiCo Is Positioned for Long-term Growth
We made PepsiCo a Long Idea in September 2017. Here’s what we learned from 1Q21 earnings and, despite the stock’s underperformance since our original article, why the stock still provides quality risk/reward.
What’s Working: PepsiCo’s scale gives it a distribution advantage, especially in North America, which accounted for 67% of the firm’s total revenue in 1Q21. Existing customer relationships and shelf-space help in two ways:
- better insulate the firm from new entrants that lack scale
- allow the firm to adapt to changing consumer tastes and preferences and quickly offer new products to customers across the globe
PepsiCo’s more diversified product line is a major advantage the firm over its largest peer, Coca-Cola (KO). Though both firms are the two largest soft drink companies in North America, PepsiCo generated 55% of its 1Q21 revenue from its food segment, which is up from 52% in 2016. Taken together, PepsiCo’s and Coca-Cola’s revenue growth are heading in different directions. Since 2016, PepsiCo’s sales have risen by 3% compounded annually while Coca-Cola’s have fallen by 6% compounded annually.
PepsiCo’s growth is not limited to just one region or product type, either. PepsiCo’s total revenue rose nearly 7% year-over-year in 1Q21. Revenue was up 54% YoY across Africa, Middle East, South Asia, and Asia Pacific while Frito-Lay and Quaker Foods’ revenue rose 4% and 2%, respectively YoY as the rise in stay-at-home snacking and breakfast continues.
Expectations for the food and beverages market suggest PepsiCo’s revenue growth will continue as well. ReportLinker, an industry research firm, expects the global food and beverages market to grow by 7% compounded annually from 2020 to 2025.
What’s Not Working: Long-term trends away from sugary drinks and traditional snacks hurt the firm’s legacy business as many of its brands are not as healthy as many new products. PepsiCo must effectively deliver and market healthier products given aggressive public health campaigns that have associated sugary drinks with cigarettes. To do so, PepsiCo has put together nutrition guidelines across 20 different categories of snacks and beverages to ensure the firm stays focused on providing products that are meeting the changing health demands of its customers.
In addition to health concerns, environmental concerns for food and beverage companies around waste from packaging materials and excessive water use continue to grow. Without effort to reign in such waste, PepsiCo could garner a stigma as being environmentally unfriendly, which could hurt sales.
Current Price Still Leaves Upside: Below, we use our reverse DCF model to analyze the expectations for future growth in cash flows baked into PEP’s current price.
In this scenario, we assume Pepsi:
- maintains its 2020 NOPAT margin of 12% (which is the firm’s five-year low) and
- grows revenue by 1% compounded annually (vs. consensus revenue estimate CAGR of 5% from 2021-2023) for the next decade
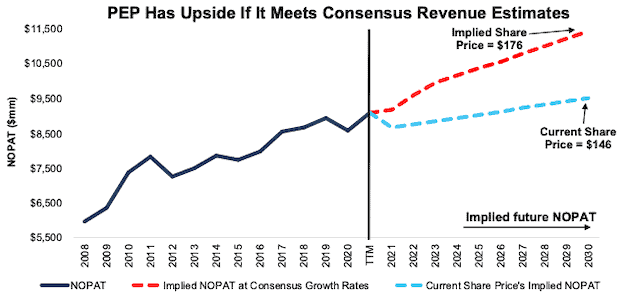
In this scenario, PepsiCo’s NOPAT grows by just 1% compounded annually over the next decade and the stock is worth $146/share today – equal to the current price. See the math behind this reverse DCF scenario. For reference, before the pandemic, Pepsi grew its NOPAT by 3% compounded annually from 2009 to 2019.
$176/Share If Consensus Is Right: If we assume:
- PepsiCo maintains margins at 12% and
- grows revenue by 5% compounded annually from 2021-2023 (equal to consensus revenue estimates), and
- grows revenue by 2% compounded annually each year thereafter through 2030, which is equal to its prior 10-year revenue CAGR, then
the stock is worth $176/share today, or 21% above the current price. See the math behind this reverse DCF scenario.
Figure 3: Pepsi’s Historical and Implied NOPAT: DCF Valuation Scenarios
Sources: New Constructs, LLC and company filings
Omnicom Group Still Looks Cheap
We made Omnicom a Long Idea in May 2018 and made it one of our “See Through the Dip” stocks in May 2020. Since May 2020, Omnicom’s stock price has increased 46%, in line with the S&P 500. Below, we show what we learned from 1Q21 earnings and why OMC remains an open Long Idea. Our 4Q20 earnings update is here.
What’s Working: We anticipate a decline in Omnicom’s advertising business due to the economic slowdown in 2020, but expectations for Omnicom’s future cash flows remain too negative.
Omnicom’s revenue improved quarter-over-quarter for the third consecutive quarter in 1Q21, which demonstrates the firm’s ongoing recovery from the pandemic. Revenue rose 0.6% year-over-year to $3.4 billion marking it as the first YoY revenue increase since the onset of the pandemic. Omnicom’s revenue growth further affirms our thesis that the essential nature of the advertising business means businesses will resume spending on advertising beyond the pandemic-driven economic slowdown.
As we’ve noted before, the firm’s flexible cost structure allowed it to lower costs in 2020 to match a lower revenue environment. Despite declining revenue for the full year, the firm maintained profitability and generated $1.8 billion (12% of its market cap) in FCF in 2020.
What’s Not Working: While other parts of the business grew in 1Q21, the firm’s CRM Experiential segment was down 33% year-over-year as COVID-19-related restrictions from holding large events continue to challenge the segment. For reference, this segment accounted for 3% of the firm’s total revenue in 1Q21. The headwinds impacting this segment should abate if restrictions on large events are lifted in the coming months, as appears to be the trend.
Current Price Still Leaves Upside: Below, we use our reverse DCF model to analyze the expectations for future growth in cash flows baked into Omnicom’s current share price.
In this scenario, we assume:
- Omnicom maintains its 2020 NOPAT margin of 9.9% (below five-year average of 10.3%), and
- revenue falls by 8% compounded annually (vs. consensus revenue estimate CAGR of +4% through 2022) for the next decade
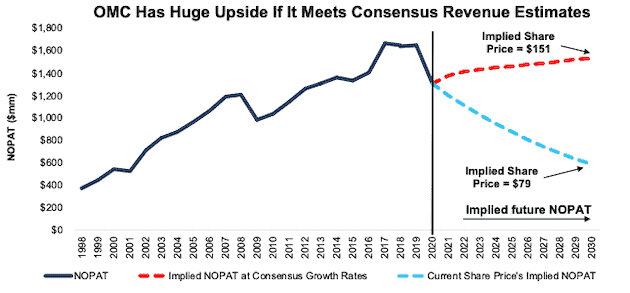
In this scenario, Omnicom’s NOPAT falls by 9% compounded annually from 2019 to 2030 and the stock is worth $79/share today – equal to the current price. See the math behind this reverse DCF scenario. For reference, before the pandemic, OMC grew NOPAT by 5% compounded annually from 2009 to 2019.
$151/Share Looks Very Doable: If we assume:
- Omnicom maintains NOPAT margins at 9.9% and
- grows revenue by 4% compounded annually through 2022 (equal to consensus revenue estimates) and
- grows revenue by 1% each year thereafter through 2030, which is below the average annual global GDP growth rate of 3.5% since 1961, then
the stock is worth $151/share today – 91% above the current price. See the math behind this reverse DCF scenario.
Figure 4: Omnicom’s Historical and Implied NOPAT: DCF Valuation Scenarios
Sources: New Constructs, LLC and company filings
This article originally published on April 21, 2021.
Disclosure: David Trainer owns JPM. David Trainer, Kyle Guske II, and Matt Shuler receive no compensation to write about any specific stock, sector, style, or theme.
Follow us on Twitter, Facebook, LinkedIn, and StockTwits for real-time alerts on all our research.
[1] Our reports utilize our Core Earnings, a more reliable measure of profits, as demonstrated in Core Earnings: New Data & Evidence, a paper by professors at Harvard Business School (HBS) & MIT Sloan. Recently accepted by the Journal of Financial Economics, the paper proves that our data is superior to all the metrics offered elsewhere.
[2] The SLR = Tier 1 Capital / Total Leverage Exposure (including deposits). Without an offsetting increase in Tier 1 capital, an increase in deposits lowers the SLR.


