
One new stock made August’s Exec Comp Aligned with ROIC Model Portfolio, available to members as of August 12, 2022.
Recap From July’s Picks
Our Exec Comp Aligned with ROIC Model Portfolio (+10.0%) underperformed the S&P 500 (+11.1%) from July 14, 2022, through August 10, 2022. The best performing stock in the portfolio was up 29%. Overall, seven out of the 15 Exec Comp Aligned with ROIC Stocks outperformed the S&P 500 from July 14, 2022, through August 10, 2022.
This report leverages our cutting-edge Robo-Analyst technology to deliver proven-superior[1] fundamental research and support more cost-effective fulfillment of the fiduciary duty of care.
This Model Portfolio includes stocks that earn an Attractive or Very Attractive rating and align executive compensation with improving ROIC. We think this combination provides a uniquely well-screened list of long ideas because return on invested capital (ROIC) is the primary driver of shareholder value creation.
New Feature Stock for August: Thor Industries, Inc. (THO: $93/share)
Thor Industries, Inc. (THO) is the featured stock in August’s Exec Comp Aligned with ROIC Model Portfolio.
Thor Industries has grown revenue and net operating profit after tax (NOPAT) by 16% and 21% compounded annually, respectively, over the past ten years. See Figure 1. The company’s NOPAT margin rose from 4% in fiscal 2011 (fiscal year ends on July 31) to 8% over the trailing twelve months (TTM), while ROIC rose from 13% to 22% over the same time.
Figure 1: Thor Industries’ NOPAT & Revenue Growth: Fiscal 2011 – TTM
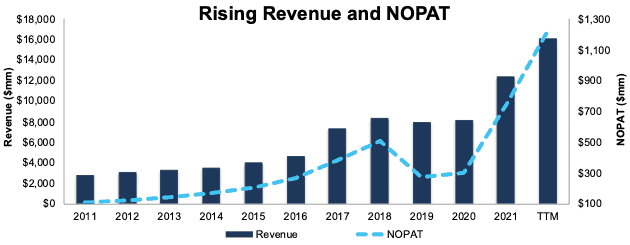
Sources: New Constructs, LLC and company filings
Executive Compensation Properly Aligns Executive Incentives
Thor Industries’ executive compensation plan aligns executives’ interests with shareholders’ interests by tying the payout of performance share units to a three-year ROIC performance goal.
Thor Industries’ inclusion of ROIC as a performance goal has helped create shareholder value through rising ROIC and economic earnings. Thor Industries’ ROIC improved from 9% in fiscal 2019 to 22% over the TTM, and the company’s economic earnings rose from $52 million to $870 million over the same period.
Figure 2: Thor Industries’ ROIC: Fiscal 2019 – TTM
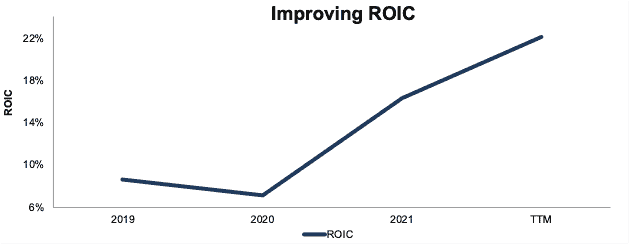
Sources: New Constructs, LLC and company filings
Thor Industries Is Undervalued
At its current price of $93/share, THO has a price-to-economic book value (PEBV) ratio of 0.3. This ratio means the market expects Thor Industries’ NOPAT to permanently fall by 70%. This expectation seems overly pessimistic for a company that has grown NOPAT by 21% compounded annually over the past 10 years and 19% compounded annually over the past two decades.
If Thor Industries’ NOPAT margin falls to its ten-year average of 5% (vs. 8% TTM), and the company’s NOPAT falls 1% compounded annually over the next 10 years, the stock would be worth $120+/share today – a 29% upside. See the math behind this reverse DCF scenario. Should the company grow NOPAT more in line with historical growth rates, the stock has even more upside.
Critical Details Found in Financial Filings by Our Robo-Analyst Technology
Below are specifics on the adjustments we make based on Robo-Analyst findings in Thor Industries’ 10-Qs and 10-Ks:
Income Statement: we made $179 million in adjustments, with a net effect of removing $83 million in non-operating expenses (1% of revenue). Clients can see all adjustments made to Thor Industries’ income statement on the GAAP Reconciliation tab on the Ratings page on our website.
Balance Sheet: we made $663 million in adjustments to calculate invested capital with a net decrease of $307 million. One of the largest adjustments was $123 million (3% of reported net assets) in midyear acquisitions. Clients can see all adjustments made to Thor Industries’ balance sheet on the GAAP Reconciliation tab on the Ratings page on our website.
Valuation: we made $2.0 billion in adjustments, all of which decreased shareholder value. Apart from total debt, the most notable adjustment to shareholder value was $140 million in net deferred tax liabilities. This adjustment represents 3% of Thor Industries’ market cap. Clients can see all adjustments to Thor Industries’ valuation on the GAAP Reconciliation tab on the Ratings page on our website.
This article originally published on August 18, 2022.
Disclosure: David Trainer, Kyle Guske II, Matt Shuler, and Brian Pellegrini receive no compensation to write about any specific stock, style, or theme.
Follow us on Twitter, Facebook, LinkedIn, and StockTwits for real-time alerts on all our research.
[1] Our research utilizes our Core Earnings, a more reliable measure of profits, as proven in Core Earnings: New Data & Evidence, written by professors at Harvard Business School (HBS) & MIT Sloan and published in The Journal of Financial Economics.
1 Response to "Featured Stock in August’s Exec Comp & ROIC Model Portfolio"
most people buy RVs on borrowed money, so a rising rate environment with wage growth trailing
the rate of inflation is not the best economic backdrop for this company. Its cost for materials
are also probably rising sharply, testing their margins. Like the kindred home builders, it’s a very cyclical business
at what is probably near a point of peak profits, which give the look back a somewhat deceptive rosy appearance.
i realize the p/e is extremely low and it is a pretty good company, but should the earnings get halved
(as happened over the course of 2018-2019 for example) it’s going to be hard to find buyers for the stock.