
Two new stocks make August’s Exec Comp Aligned with ROIC Model Portfolio, available to members as of August 16, 2023.
Recap from July Picks
Our Exec Comp Aligned with ROIC Model Portfolio (+4.4%) outperformed the S&P 500 (-0.3%) from July 14, 2023 through August 14, 2023. The best performing stock in the portfolio was up 25%. Overall, 9 out of the 15 Exec Comp Aligned with ROIC Stocks outperformed the S&P from July 14, 2023 through August 14, 2023.
This report leverages our cutting-edge Robo-Analyst technology to deliver proven-superior[1] fundamental research and support more cost-effective fulfillment of the fiduciary duty of care.
This Model Portfolio includes stocks that earn an Attractive or Very Attractive rating and align executive compensation with improving ROIC. This combination provides a unique list of long ideas as the primary driver of shareholder value creation is return on invested capital (ROIC).
New Stock Feature for August: Humana Inc. (HUM: $489/share)
Humana (HUM) is the featured stock in August’s Exec Comp Aligned with ROIC Model Portfolio.
Humana has grown revenue and net operating profit after tax (NOPAT) by 9% and 10% compounded annually, respectively, since 2012. The company’s NOPAT margin improved from 3% in 2016 to 4% in the trailing twelve months (TTM), while invested capital turns rose from 2.9 to 3.1 over the same time. Rising NOPAT margins and invested capital turns drive the company’s return on invested capital (ROIC) from 7% in 2016 to 11% in the TTM.
Figure 1: Humana’s Revenue & NOPAT: 2012 – TTM
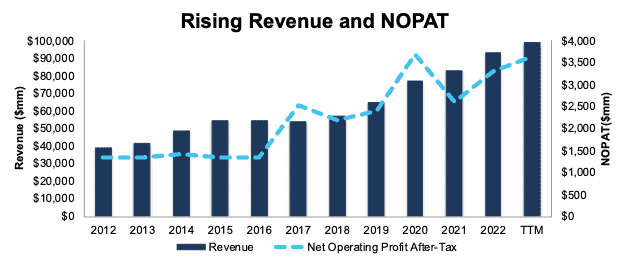
Sources: New Constructs, LLC and company filings
Executive Compensation Properly Aligns Incentives
Humana’s executive compensation plan aligns the interests of executives and shareholders by tying its performance-based awards to three-year aggregated adjusted ROIC. According to Humana’s proxy statement, the company ties at least 55% of long-term incentives to adjusted ROIC.
The company’s inclusion of adjusted ROIC, a variation of ROIC, as a performance goal has helped create shareholder value by driving higher ROIC and economic earnings. When we calculate ROIC using our superior fundamental data, we find that Humana’s ROIC has increased from 7% in 2016 to 11% in the TTM. Economic earnings rose from $705 million to $1.8 billion over the same time.
Figure 2: Humana’s ROIC: 2016 – TTM
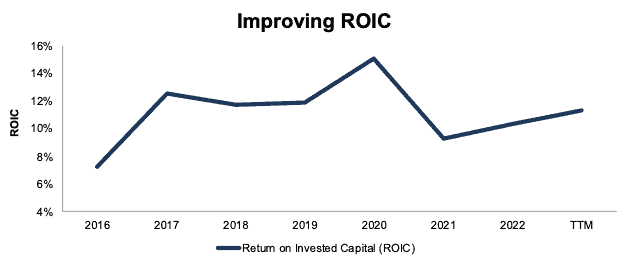
Sources: New Constructs, LLC and company filings
HUM Has Further Upside
At the current price of $489/share, HUM has a price-to-economic book value (PEBV) ratio of 1.2. Though the company’s PEBV ratio is higher than other featured stocks, the stock still holds quality upside.
If we assume Humana’s NOPAT margin remains at 4% (equal to TTM margin) and the company grows revenue by 6% compounded annually (vs. consensus estimates of 10% in 2023 and 8% in 2024) over the next decade, the stock would be worth $612/share today – a 25% upside. See the math behind this reverse DCF scenario. In this scenario, Humana’s NOPAT grows 6% compounded annually through 2032.
For reference, Humana has grown NOPAT by 6% compounded annually since 2016. Should the company grow NOPAT more in line with historical growth rates, the stock has even more upside.
Critical Details Found in Financial Filings by Our Robo-Analyst Technology
Below are specifics on the adjustments we made based on Robo-Analyst findings in Humana’s 10-Qs and 10-K:
Income Statement: we made $982 million in adjustments with a net effect of removing $246 million in non-operating expenses (<1% of revenue). Clients can see all adjustments made to Humana’s income statement on the GAAP Reconciliation tab on the Ratings page on our website.
Balance Sheet: we made $6.8 billion in adjustments to calculate invested capital with a net increase of $6.8 billion. One of the largest adjustments was $1.4 billion (5% of reported net assets) in asset write-downs. Clients can see all adjustments made to Humana’s balance sheet on the GAAP Reconciliation tab on the Ratings page on our website.
Valuation: we made $12.7 billion in adjustments, with a net effect of decreasing shareholder value by $12.7 billion. The largest adjustment to shareholder value was $12.6 billion in total debt, which includes $451 million in operating leases. This total debt adjustment represents 21% of Humana’s market value. Clients can see all adjustments to Humana’s valuation on the GAAP Reconciliation tab on the Ratings page on our website.
This article was originally published on August 22, 2023.
Disclosure: David Trainer, Kyle Guske II, Hakan Salt, and Italo Mendonça receive no compensation to write about any specific stock, style, or theme.
Questions on this report or others? Join our Society of Intelligent Investors and connect with us directly.
[1] Our research utilizes our Core Earnings, a more reliable measure of profits, as proven in Core Earnings: New Data & Evidence, written by professors at Harvard Business School (HBS) & MIT Sloan and published in The Journal of Financial Economics.