
Three new stocks make June’s Exec Comp Aligned with ROIC Model Portfolio, available to members as of June 15, 2022.
Recap From May’s Picks
Our Exec Comp Aligned with ROIC Model Portfolio (-8.9%) underperformed the S&P 500 (-6.7%) from May 13, 2022, through June 13, 2022. The best performing stock in the portfolio was up 1%. Overall, eight out of the 15 Exec Comp Aligned with ROIC Stocks outperformed the S&P 500 from May 13, 2022, through June 13, 2022.
This report leverages our cutting-edge Robo-Analyst technology to deliver proven-superior[1] fundamental research and support more cost-effective fulfillment of the fiduciary duty of care.
This Model Portfolio includes stocks that earn an Attractive or Very Attractive rating and align executive compensation with improving ROIC. We think this combination provides a uniquely well-screened list of long ideas because return on invested capital (ROIC) is the primary driver of shareholder value creation.
New Feature Stock for June: Qualcomm Inc. (QCOM: $122/share)
Qualcomm Inc. (QCOM) is the featured stock in June’s Exec Comp Aligned with ROIC Model Portfolio.
Qualcomm has grown revenue and net operating profit after tax (NOPAT) by 8% and 7% compounded annually, respectively, over the past ten years. See Figure 1. More recently, the company’s NOPAT margin rose from 20% in fiscal 2017 (FYE was 9/24/2017) to 28% over the trailing twelve months (TTM), while invested capital turns improved from 1.1 to 1.6 over the same time. Rising NOPAT margins and invested capital turns drive the company’s ROIC from 21% in fiscal 2017 to 45% TTM.
Figure 1: Qualcomm’s NOPAT & Revenue Growth: Fiscal 2011 – TTM
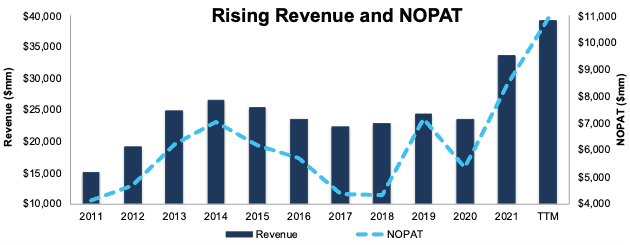
Sources: New Constructs, LLC and company filings
Executive Compensation Properly Aligns Executive Incentives
Qualcomm’s executive compensation plan aligns the interests of management with those of shareholders by tying 50% of awarded performance share units (PSUs) to a three-year (fiscal 2020 – 2022) Adjusted ROIC goal.
Qualcomm’s inclusion of ROIC as a performance goal has helped create shareholder value through rising ROIC and economic earnings. Qualcomm’s ROIC improved from 21% in fiscal 2017 to 45% TTM and the company’s economic earnings tripled from $3.0 billion to $9.2 billion over the same period.
Figure 2: Qualcomm’s ROIC: Fiscal 2017 – TTM
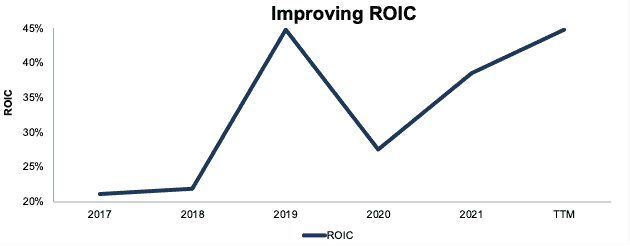
Sources: New Constructs, LLC and company filings
Qualcomm Is Undervalued
At its current price of $122/share, QCOM has a price-to-economic book value (PEBV) ratio of 0.9. This ratio means the market expects Qualcomm’s NOPAT to permanently fall by 10%. This expectation seems overly pessimistic for a company that has grown NOPAT by 7% compounded annually over the past 10 years and 17% compounded annually over the past two decades.
If Qualcomm’s NOPAT margin falls to its three-year average of 26% (vs. 28% TTM), and the company grows NOPAT by 5% compounded annually over the next 10 years, the stock is worth $150/share today – a 23% upside. See the math behind this reverse DCF scenario. Should the company grow NOPAT more in line with historical growth rates, the stock has even more upside.
Critical Details Found in Financial Filings by Our Robo-Analyst Technology
Below are specifics on the adjustments we make based on Robo-Analyst findings in Qualcomm’s 10-Q’s and 10-K:
Income Statement: we made $1.9 billion in adjustments, with a net effect of removing $618 million in non-operating income (2% of revenue). Clients can see all adjustments made to Qualcomm’s income statement on the GAAP Reconciliation tab on the Ratings page on our website.
Balance Sheet: we made $24.0 billion in adjustments to calculate invested capital with a net decrease of $8.0 billion. One of the largest adjustments was $5.4 billion (19% of reported net assets) in asset write-downs. Clients can see all adjustments made to Qualcomm’s balance sheet on the GAAP Reconciliation tab on the Ratings page on our website.
Valuation: we made $27.5 billion in adjustments with a net effect of decreasing shareholder value by $6.0 billion. Apart from total debt, the most notable adjustment to shareholder value was $10.8 billion in excess cash. This adjustment represents 8% of Qualcomm’s market cap. Clients can see all adjustments to Qualcomm’s valuation on the GAAP Reconciliation tab on the Ratings page on our website.
This article originally published on June 23, 2022.
Disclosure: David Trainer, Kyle Guske II, and Matt Shuler receive no compensation to write about any specific stock, style, or theme.
Follow us on Twitter, Facebook, LinkedIn, and StockTwits for real-time alerts on all our research.
[1] Our research utilizes our Core Earnings, a more reliable measure of profits, as proven in Core Earnings: New Data & Evidence, written by professors at Harvard Business School (HBS) & MIT Sloan and published in The Journal of Financial Economics.