
Thirteen stocks were added to our Dividend Growth Stocks Model Portfolio this month, which was made available to members on May 27, 2022.
Recap From April’s Picks
On a price return basis our Dividend Growth Stocks Model Portfolio (-4.2%) outperformed the S&P 500 (-7.1%) by 2.9%, and on a total return basis the Model Portfolio (-4.0%) outperformed the S&P 500 (-7.1%) by 3.1%. The best performing stock was up 6%. Overall, 22 out of the 30 Dividend Growth Stocks outperformed the S&P 500 from April 28, 2022 through May 25, 2022.
This model portfolio mimics an “All Cap Blend” style with a focus on dividend growth. Selected stocks earn an Attractive or Very Attractive rating, generate positive free cash flow (FCF) and economic earnings, offer a current dividend yield >1%, and have a 5+ year track record of consecutive dividend growth. This model portfolio is designed for investors who are more focused on long-term capital appreciation than current income, but still appreciate the power of dividends, especially growing dividends.
This report leverages our cutting-edge Robo-Analyst technology to deliver proven-superior[1] fundamental research and support more cost-effective fulfillment of the fiduciary duty of care.
Featured Stock From May: Johnson & Johnson (JNJ: $178/share)
Johnson & Johnson (JNJ) is the featured stock from May’s Dividend Growth Stocks Model Portfolio. We made Johnson & Johnson a Long Idea in February 2020 and the stock is up 24% compared to a 32% gain for the S&P 500 since then. JNJ still offers excellent risk/reward, as detailed in our April 2022 update here.
Johnson & Johnson grew revenue by 4% compounded annually and net operating profit after-tax (NOPAT) by 5% compounded annually over the past decade. Johnson & Johnson’s NOPAT margin improved from 20% in 2011 to 23% over the trailing twelve months (TTM). Though the company’s return on invested capital (ROIC) fell from 16% in 2011 to 15% over the TTM, its economic earnings, the true cash flows of the business, rose from $9.9 billion to $16.1 billion over the same time.
Figure 1: Johnson & Johnson’s NOPAT & Revenue Since 2011
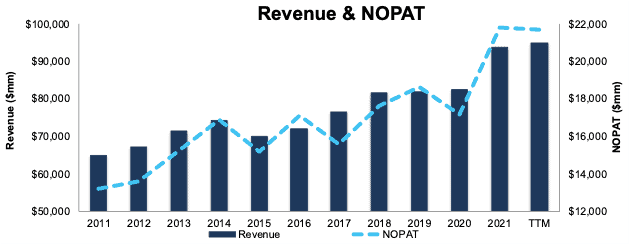
Sources: New Constructs, LLC and company filings
FCF Exceeds Dividends by Wide Margin
Johnson & Johnson has increased its dividend in each of the past 60 years. The company increased its regular dividend from $3.32/share in 2017 to $4.19/share in 2021, or 6% compounded annually. The current quarterly dividend, when annualized, equals $4.52/share and provides a 2.5% dividend yield.
More importantly, Johnson & Johnson’s strong free cash flow (FCF) easily exceeds the company’s growing dividend payments. From 2017 – 2021, Johnson & Johnson’s cumulative $59.6 billion (13% of current market cap) in FCF is 1.2x the $49.9 billion in dividends paid out, per Figure 2. Over the TTM, the company generated $23.1 billion in FCF and paid out $11.2 billion in dividends.
Figure 2 also shows that Johnson & Johnson’s FCF significantly exceeded its dividend payments in four of the past five years. The company’s $30 billion acquisition of Actelion was the primary driver of its negative FCF in 2017.
Figure 2: Free Cash Flow vs. Regular Dividend Payments
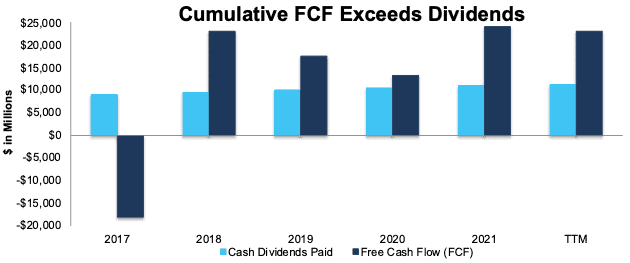
Sources: New Constructs, LLC and company filings
Companies with FCF well above dividend payments provide higher quality dividend growth opportunities because we know the company generates the cash to support a higher dividend. On the other hand, the dividend of a company where FCF falls short of the dividend payment over time cannot be trusted to grow or even maintain its dividend because of inadequate free cash flow.
Johnson & Johnson Has Upside Potential
At its current price of $178/share, JNJ has a price-to-economic book value (PEBV) ratio of 0.9. This ratio means the market expects Johnson & Johnson’s NOPAT to permanently decline by 10%. This expectation seems overly pessimistic for a company that has grown NOPAT by 7% compounded annually over the past two decades.
If Johnson & Johnson’s NOPAT margin falls to 22% (three-year average) and the company grows NOPAT by just 3% compounded annually for the next decade, the stock is worth $244/share today – a 37% upside. See the math behind the reverse DCF scenario.
Should the company grow NOPAT more in line with historical growth rates, the stock has even more upside. Add in Johnson & Johnson’s 2.5% dividend yield and history of dividend growth, and it’s clear why this stock is in May’s Dividend Growth Stocks Model Portfolio.
Critical Details Found in Financial Filings by Our Robo-Analyst Technology
Below are specifics on the adjustments we make based on Robo-Analyst findings in Johnson & Johnson’s 10-K and 10-Qs:
Income Statement: We made $4.7 billion in adjustments with a net effect of removing $922 million in non-operating expenses (1% of revenue). Clients can see all adjustments made to Johnson & Johnson’s income statement on the GAAP Reconciliation tab on the Ratings page on our website.
Balance Sheet: We made $90.5 billion in adjustments to calculate invested capital with a net increase of $6.8 billion. The most notable adjustment was $15.6 billion (11% of reported net assets) in asset write-downs. Clients can see all adjustments made to Johnson & Johnson’s balance sheet on the GAAP Reconciliation tab on the Ratings page on our website.
Valuation: We made $71.1 billion in adjustments with a net effect of decreasing shareholder value by $14.1 billion. The most notable adjustment to shareholder value was $28.5 billion in excess cash. This adjustment represents 6% of Johnson & Johnson’s market value. Clients can see all adjustments to Johnson & Johnson’s valuation on the GAAP Reconciliation tab on the Ratings page on our website.
This article originally published on June 2, 2022.
Disclosure: David Trainer, Kyle Guske II, and Matt Shuler receive no compensation to write about any specific stock, style, or theme.
Follow us on Twitter, Facebook, LinkedIn, and StockTwits for real-time alerts on all our research.
[1] Our research utilizes our Core Earnings, a more reliable measure of profits, as proven in Core Earnings: New Data & Evidence, written by professors at Harvard Business School (HBS) & MIT Sloan and published in The Journal of Financial Economics.