We published an update on JNJ on April 27, 2022. A copy of the associated Earnings Update report is here.
During the real earnings season, we find many companies whose GAAP earnings understate core earnings, a superior measure of profits[1]. Only by reading all of the financial footnotes and MD&A can investors get an accurate measure of a firm’s profits.
This week, we feature two companies from the beginning of filing season that have core earnings trending in the opposite direction of GAAP earnings. PepsiCo Inc. (PEP: $143/share) and Johnson & Johnson (JNJ: $145/share) are this week’s Long Ideas.
PepsiCo Inc. (PEP) – Attractive Rating
We first featured PepsiCo (PEP) as a Long Idea in September 2017. Since then, the stock is up 29% while the S&P 500 is up 27%. After analyzing its 2019 10-K (filed on February 13, 2020), we upgraded PepsiCo to Attractive (from Neutral). PepsiCo’s GAAP net income gives investors a negative view of the firm despite fundamentals trending upward in 2019.
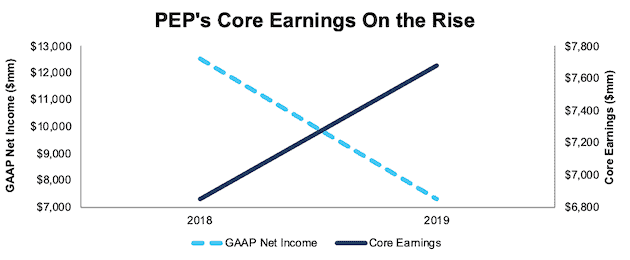
Understated Profits: In 2019, PEP’s GAAP net income fell by 42% year-over-year (YoY) while core earnings grew 12% YoY, per Figure 1.
Figure 1: PEP’s Misleading GAAP Net Income Masks Rising Core Earnings

Sources: New Constructs, LLC and company filings.
PEP’s GAAP net income misleads investors into thinking profits are falling when the opposite is true.
In 2019, PEP had -$363 million in earnings distortion that caused GAAP earnings to be understated. Notable unusual expenses both hidden and reported in PEP’s 10-K include:
- $296 million in settlement/curtailment losses in the firm’s U.S. pension – Page 103
- $253 million & $115 million in restructuring charges hidden in SG&A and cost of sales related to PEP’s 2019 Productivity Plan – Page 87
- $44 million in other pension and retiree medical benefits (expense) – Page 73
- $34 million and $21 million in inventory fair value adjustments and merger and integration charges hidden in cost of sales and SG&A – Page 59
- $12 million in settlement/curtailment losses in the firm’s International pension – Page 103
These unusual expenses were partially offset by:
- $200 million in interest and other income – Page 73
- $57 million and $55 million in the mark-to-market net impact related to commodity derivative contracts hidden in cost of sales and SG&A – Page 59
Only by removing these unusual expenses and gains can we evaluate the core earnings of PEP’s operations. In total, we identified $0.26/share (5% of GAAP EPS) in net unusual expenses in PEP’s 2019 GAAP results. After removing this earnings distortion, PEP’s 2019 core earnings of $5.46/share are higher than GAAP EPS of $5.20.
PEP’s Earnings Distortion Score (as featured on CNBC Squawk Box) is currently “In-Line”, which means we expect it to report in-line with consensus expectations. Our Earnings Distortion Scores provide investors with a short-term look at the likelihood a firm will beat/miss consensus expectations. Longer-term, we leverage our overall Risk/Reward Ratings, which take into account a firm’s historical profitability and expectations baked into the current stock price. PepsiCo earns an Attractive Risk/Reward rating, which means it provides quality risk/reward going forward, even if it’s not more likely to beat consensus expectations in the coming quarter.
Economic Earnings Growing Faster Than GAAP Too
To get the full picture of a company’s operations and hold management accountable for capital allocation, we account for changes to the balance sheet so we can calculate an accurate return on invested capital (ROIC) and economic earnings, the true drivers of shareholder value.
Some notable adjustments to PEP’s 2019 balance sheet were:
- $14.3 billion in accumulated other comprehensive loss
- $2.4 billion in excess cash
- $1.5 billion in operating leases
- $468 million in hidden deferred compensation liabilities
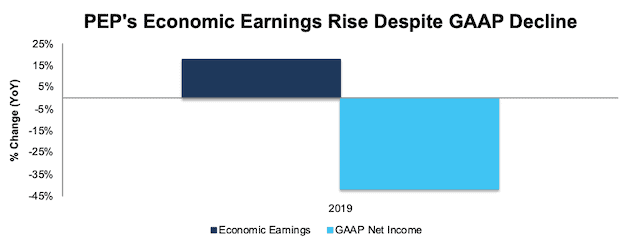
After all adjustments, we find that PEP’s economic earnings grew 18% YoY in 2019 while GAAP net income fell 42% YoY, per Figure 2. In addition to rising core and economic earnings, PEP maintained ROIC at its 10-year average of 10% while it improved net operating profit after-tax (NOPAT) margins from 12.6% in 2018 to 12.9% in 2019.
Figure 2: PEP’s GAAP Net Income Also Masks Rising Economic Earnings

Sources: New Constructs, LLC and company filings.
Undervalued Shares
PEP is up 7% over the past six months while the S&P 500 is up 10%. We think this underperformance can be attributed to PEP’s understated earnings, because it’s not warranted by the firm’s fundamentals.
When we analyze the cash flow expectations baked into the stock price using our reverse DCF model, we see that PEP is significantly undervalued.
At its current price of $143/share, PEP has a price-to-economic book value (PEBV) ratio of 1.1. This ratio means the market expects PEP’s NOPAT to grow by only 10% over the remainder of its corporate life. This expectation seems pessimistic given that PEP has grown NOPAT by 3% compounded annually over the past decade and 9% compounded annually over the past two decades.
If PEP can simply maintain 2019 NOPAT margins (13%) and grow NOPAT by just 3% compounded annually for the next decade, the stock is worth $177/share today – a 24% upside. See the math behind this reverse DCF scenario.
Why PEP Will Beat Expectations
With strong fundamentals, and leading positions in the global snacks and beverages markets, PEP is well-positioned to capitalize on industry growth, both organically and through acquisitions. Mordor Intelligence projects the snack food market to grow by 5% compounded annually through 2025. Research and Markets projects the global beverages market to grow by 3% through 2024. In 2019, PepsiCo’s organic revenue grew 4.5% YoY, which management noted was the fastest growth rate since 2015.
Best of all, PepsiCo continues to align executive interests with shareholder interests by including ROIC in its executive compensation plan. In 2018, “core net ROIC improvement” was one of six metrics used when determining annual incentive awards for both former CEO Indra Nooyi and current CEO Ramon Laguarta. In addition, 50% of performance stock units for all executives are tied to “3-year cumulative increase in core net ROIC.” PEP’s executive compensation plan lowers the risk of investing in the stock because we know executives are held accountable for prudent stewardship of capital.
Johnson & Johnson (JNJ) – Attractive Rating
We first featured Johnson & Johnson (JNJ) as a Long Idea in April 2014 and closed the position in August 2015. Over that time, the stock was up 1% while the S&P 500 was up 11%. After analyzing its 2019 10-K (filed on February 18, 2020), we found, as with PepsiCo, JNJ’s GAAP net income fell YoY despite core earnings rising.
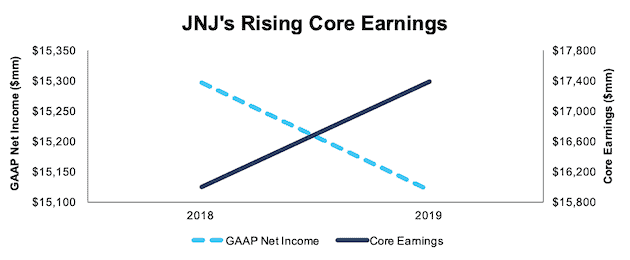
Understated Profits: In 2019, JNJ’s GAAP net income fell by 1% YoY while core earnings grew 9% YoY, per Figure 3.
Figure 3: JNJ’s GAAP Net Income Falls While Core Earnings Rise

Sources: New Constructs, LLC and company filings.
In other words, JNJ’s GAAP net income indicates the firm’s profitability is trending down when the opposite is true.
In 2019, JNJ had -$2.3 billion in earnings distortion that caused GAAP earnings to be understated. Notable unusual expenses both hidden and reported in JNJ’s 10-K include:
- $2.5 billion in other expenses primarily related to litigation – Page 36
- $1.1 billion in asset write-downs – Page 39
- $890 million in research and development impairment charges related to the abandonment of development of AL-8176
- $266 million in restructuring charges related to the Global Supply Chain initiative
- $107 million, $90 million, $67 million, and $55 million in acquisition related costs recorded in 3Q19, 4Q19, 1Q19, and 2Q19 respectively – Page 79
- $100 million in restructuring costs hidden in cost of products sold – Page 102
After removing these unusual items, we can evaluate the core earnings of JNJ’s operations. In total, we identified $0.84/share (15% of GAAP EPS) in net unusual expenses in JNJ’s 2019 GAAP results. After removing this earnings distortion, JNJ’s 2019 core earnings of $6.48/share are higher than GAAP EPS of $5.63.
With significantly understated earnings, JNJ earns a “Beat” Earnings Distortion Score, which means it is more likely to beat consensus expectations. Johnson & Johnson also earns an Attractive Risk/Reward rating, which means it provides quality risk/reward over the long term as well.
Economic Earnings Look Better Than GAAP Too
We also made the following adjustments to JNJ’s balance sheet to calculate an accurate ROIC and economic earnings:
- $18.8 billion in excess cash
- $15.9 billion in accumulated other comprehensive loss
- $12.8 billion in accumulated asset write-downs (up from $11.1 billion in 2018)
- $930 million in operating leases
- $338 million in hidden deferred compensation liabilities
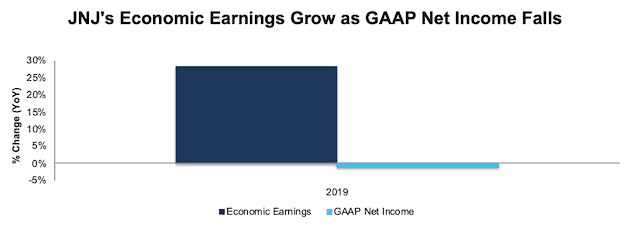
After all adjustments, we find that JNJ’s economic earnings grew 28% YoY in 2019 while GAAP net income fell 1% YoY, per Figure 4. In addition to rising core and economic earnings, JNJ improved its ROIC from 11% in 2018 to 12% in 2019 and increased its NOPAT margin from 20% to 21% over the same time.
Figure 4: YoY Change in JNJ’s Economic Earnings Vs. GAAP Net Income

Sources: New Constructs, LLC and company filings.
Shares Are Undervalued
JNJ looks undervalued whether we use traditional metrics, as in Figure 5, or analyze the expectations baked into the stock price.
Figure 5: JNJ Looks Cheap – Even by Traditional Metrics

Sources: New Constructs, LLC and company filings.
At its current price of $145/share, JNJ has a PEBV ratio of 1.2. This ratio means the market expects JNJ’s NOPAT to grow by no more than 20% over the remaining life of the firm. This expectation seems rather pessimistic given that JNJ has grown NOPAT by 16% compounded annually over the past two decades and 3% compounded annually over the past decade.
If JNJ can maintain 2019 NOPAT margins (21%) and grow NOPAT by 4% compounded annually (below overall healthcare spending CAGR) for the next decade, the stock is worth $175/share today – a 21% upside. See the math behind this reverse DCF scenario. For reference, analysts expect JNJ to grow reported earnings by 6% compounded annually over the next five years.
Expectations Could Prove Too Low
With 26 products generating over $1 billion each in annual sales, improving profitability, and ample resources (JNJ generated $16.4 billion in free cash flow in 2019), JNJ is well positioned to continue creating shareholder value. The markets JNJ operates in are expected to grow by the following:
- Global medical devices market – 5.4% compounded annually through 2025
- Overall healthcare market – 5% compounded annually through 2023
- Consumer healthcare market – 3.1% compounded annually through 2025
If JNJ can grow profits in-line with overall healthcare market spending, shares have even more upside than the DCF scenario above.
This article originally published on February 26, 2020.
Disclosure: David Trainer, Kyle Guske II, and Matt Shuler receive no compensation to write about any specific stock, sector, style, or theme.
Follow us on Twitter, Facebook, LinkedIn, and StockTwits for real-time alerts on all our research.
[1] In Core Earnings: New Data & Evidence, professors at Harvard Business School (HBS) & MIT Sloan empirically show that our “novel dataset” is superior to “Street Earnings” from Refinitiv’s IBES, owned by Blackstone (BX) and Thomson Reuters (TRI), and “Income Before Special Items” from Compustat, owned by S&P Global (SPGI).
