
Three new stocks make September’s Exec Comp Aligned with ROIC Model Portfolio, available to members as of September 16, 2020.
Recap from August’s Picks
Our Exec Comp Aligned with ROIC Model Portfolio (-0.1%) underperformed the S&P 500 (+0.3%) from August 14, 2020 through September 14, 2020. The best performing stock in the portfolio was up 9%. Overall, seven out of the 15 Exec Comp Aligned with ROIC Stocks outperformed the S&P from August 14, 2020 through September 14, 2020.
Only our research utilizes the superior data and earnings adjustments featured by the HBS & MIT Sloan paper,"Core Earnings: New Data and Evidence.” The success of this Model Portfolio highlights the value of our Robo-Analyst technology[1], which scales our forensic accounting expertise (featured in Barron’s) across thousands of stocks.
This Model Portfolio only includes stocks that earn an Attractive or Very Attractive rating and align executive compensation with improving ROIC. We think this combination provides a uniquely well-screened list of long ideas because return on invested capital (ROIC) is the primary driver of shareholder value creation.[2]
New Stock Feature for September: Humana Inc. (HUM: $385/share)
Humana Inc. (HUM) is the featured stock in September’s Exec Comp Aligned with ROIC Model Portfolio.
Humana has grown revenue and after-tax profit (NOPAT) by 8% compounded annually over the past decade. Over the past five years, Humana has grown NOPAT by 10% compounded annually. Humana’s NOPAT margin increased from 3% in 2014 to 5% over the trailing-twelve-months (TTM), while its invested capital turns improved from 2.9 to 3.3 over the same time. Rising margins and invested capital turns drive Humana’s ROIC from 8% in 2009 to 15% TTM.
Figure 1: Revenue & NOPAT Since 2009
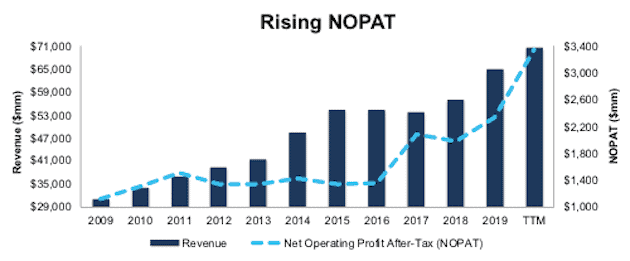
Sources: New Constructs, LLC and company filings
Compensation Plan Properly Incentivizes Executives
Humana’s executive compensation plan aligns executives’ interests with shareholders’ interests by tying compensation to return on invested capital (ROIC). Apart from base salary and short-term incentives, Humana executives received long-term equity compensation in the form of performance units (50%), stock options (25%), and restricted share units (25%) in 2019. Performance units are tied to the firm’s three-year cumulative adjusted ROIC and include a total shareholder return modifier that adjusts the final award payouts.
Per Figure 2, Humana’s inclusion of ROIC as an executive compensation metric has helped drive shareholder value creation. Human improved its ROIC from 8% in 2014 to 15% TTM while its economic earnings increased from $470 million to $2.2 billion over the same time.
Figure 2: Humana’s ROIC Since 2014
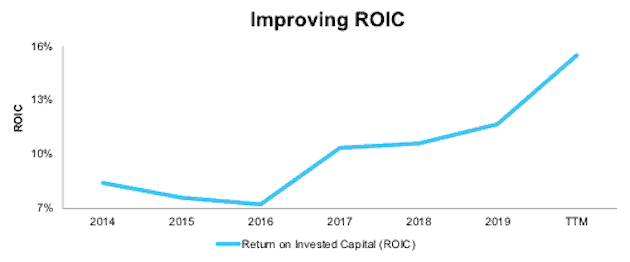
Sources: New Constructs, LLC and company filings
HUM Is Undervalued
At its current price of $385/share, HUM has a price-to-economic book value (PEBV) ratio of 0.9. This ratio means the market expects Humana’s NOPAT to permanently decline by 10%. This expectation seems overly pessimistic for a firm that has grown NOPAT by 21% compounded annually over the past two decades.
Even if Humana’s NOPAT margin falls to 4% (vs. 5% TTM) and the firm grows NOPAT by just 7% compounded annually for the next decade, the stock is worth $525/share today – a 36% upside. See the math behind this reverse DCF scenario.
Critical Details Found in Financial Filings by Our Robo-Analyst Technology
As investors focus more on fundamental research, research automation technology is needed to analyze all the critical financial details in financial filings as shown in the Harvard Business School and MIT Sloan paper, "Core Earnings: New Data and Evidence”.
Below are specifics on the adjustments we make based on Robo-Analyst findings in Humana’s 2019 10-K:
Income Statement: we made $991 million of adjustments, with a net effect of removing $373 million in non-operating income (1% of revenue). You can see all the adjustments made to Humana’s income statement here.
Balance Sheet: we made $3 billion of adjustments to calculate invested capital with a net increase of $1.4 billion. One of the most notable adjustments was $1.2 billion in asset write-downs. This adjustment represented 6% of reported net assets. You can see all the adjustments made to Humana’s balance sheet here.
Valuation: we made $9.3 billion of adjustments with a net effect of decreasing shareholder value by $9.3 billion. There were no adjustments that increased shareholder value. Apart from total debt, one of the largest adjustments to shareholder value was $341 million in deferred tax liabilities. This adjustment represents 1% of Humana’s market cap. See all adjustments to Humana’s valuation here.
This article originally published on September 23, 2020.
Disclosure: David Trainer, Kyle Guske II, and Matt Shuler receive no compensation to write about any specific stock, style, or theme.
Follow us on Twitter, Facebook, LinkedIn, and StockTwits for real-time alerts on all our research.
[1] Harvard Business School features the powerful impact of our research automation technology in the case New Constructs: Disrupting Fundamental Analysis with Robo-Analysts.
[2] This paper compares our analytics on a mega cap company to Bloomberg and Capital IQ (SPGI) in a detailed appendix.