
Recap from July Picks
Our Most Attractive Stocks (+2.9%) underperformed the S&P 500 (+3.8%) last month. Most Attractive Large Cap stock Allison Transmission Holdings (ALSN) gained 18%. Most Attractive Small Cap stock Electro Scientific Industries (ESIO) was up 17%. Overall, 13 out of the 40 Most Attractive stocks outperformed the S&P 500 in July, and 30 had positive returns.
Our Most Dangerous Stocks (+0.3%) outperformed the S&P 500 (+3.8%) as a short portfolio last month. Most Dangerous Large Cap stock Knight-Swift Transportation (KNX) fell by 15% and Most Dangerous Small Cap Stock Computer Task Group (CTG) fell by 23%. Overall, 28 out of the 40 Most Dangerous stocks outperformed the S&P 500 as shorts in July.
The successes of these model portfolios highlight the value of our machine learning and AI Robo-Analyst technology[1], which helps clients fulfill the fiduciary duty of care and make smarter investments[2].
13 new stocks make our Most Attractive list this month and 10 new stocks fall onto the Most Dangerous list this month. August’s Most Attractive and Most Dangerous stocks were made available to members on August 2, 2018.
Our Most Attractive stocks have high and rising returns on invested capital (ROIC) and low price to economic book value ratios. Most Dangerous stocks have misleading earnings and long growth appreciation periods implied by their market valuations.
Most Attractive Stocks Feature for August: Helen of Troy (HELE: $115/share)
Helen of Troy (HELE), a housewares, home, and beauty consumer goods provider, is the featured stock from August’s Most Attractive Stocks Model Portfolio.
Over the past decade, HELE has grown revenue by 9% compounded annually while after-tax operating profit (NOPAT) has grown by 10% compounded annually, to $177 million in fiscal 2018. NOPAT has increased to $189 million over the trailing twelve months. The company’s NOPAT margin has risen from 10% in 2008 to 13% TTM while its return on invested capital (ROIC) improved from 9% to 11% over the same time.
Figure 1: HELE Revenue & NOPAT Since 2008
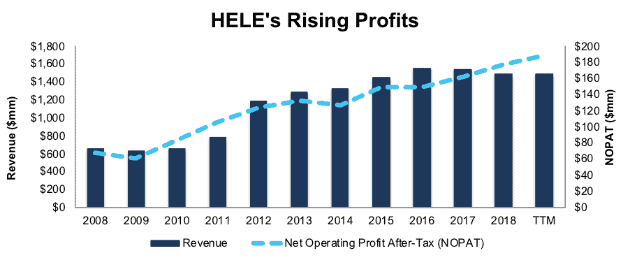
Sources: New Constructs, LLC and company filings
HELE Valuation Provides Upside
At its current price of $115/share, HELE has a price-to-economic book value (PEBV) ratio of 1.1. This ratio means the market expects HELE’s NOPAT to grow by no more than 10% over the remaining life of the corporation. This expectation seems pessimistic for a company that has grown NOPAT by 10% compounded annually over the past decade and 12% compounded annually since 1998.
If HELE can maintain current NOPAT margins (11%) and grow NOPAT by just 4% compounded annually for the next decade, the stock is worth $138/share today – a 20% upside. See the math behind this dynamic DCF scenario.
Critical Details Found in Financial Filings by Our Robo-Analyst Technology
As investors focus more on fundamental research, research automation technology is needed to analyze all the critical financial details in financial filings. Below are specifics on the adjustments we make based on Robo-Analyst findings in Helen of Troy’s 2018 10-K:
Income Statement: we made $134 million of adjustments, with a net effect of removing $133 million in non-operating expense (9% of revenue). We removed $1 million in non-operating income and $133 million in non-operating expenses. You can see all the adjustments made to HELE’s income statement here.
Balance Sheet: we made $436 million of adjustments to calculate invested capital with a net increase of $399 million. One of the largest adjustments was $322 million due to asset write-downs. This adjustment represented 24% of reported net assets. You can see all the adjustments made to HELE’s balance sheet here.
Valuation: we made $373 million> of adjustments with a net effect of decreasing shareholder value by $373 million. There were no adjustments that increased shareholder value. The largest adjustment to shareholder value was $350 million in total debt, which includes $50 million in off-balance sheet debt. This off-balance sheet debt adjustment represents 2% of HELE’s market cap.
Most Dangerous Stocks Feature: EnPro Industries (NPO: $72/share)
EnPro Industries (NPO), an engineered industrial product manufacturer, is the featured stock from August’s Most Dangerous Stocks Model Portfolio.
Since 2011, NPO has grown revenue by 3% compounded annually. Over the same time, NPO’s economic earnings, the true cash flows of the business, have declined from $34 million to -$14 million in 2017. Economic earnings have fallen further, to -$33 million, over the last twelve months. NPO’s ROIC has halved, from 10% in 2011, to 5% TTM while its NOPAT margin has fallen from 8% to 6%.
Figure 2: NPO’s Revenue & Economic Earnings Since 2011
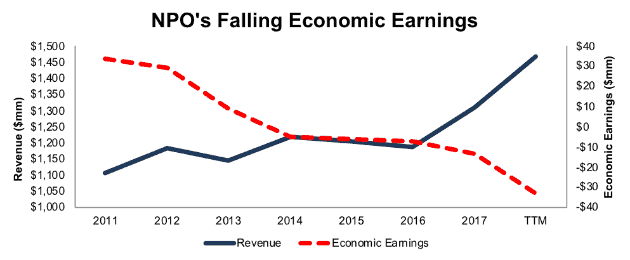
Sources: New Constructs, LLC and company filings
NPO Provides Poor Risk/Reward
In light of the deterioration in fundamentals, the market’s expectations for NPO’s profit growth look overly optimistic. To justify its current price of $72/share, NPO must maintain current NOPAT margins and grow NOPAT by 8% compounded annually for the next 14 years. See the math behind this dynamic DCF scenario. Keep in mind NPO’s NOPAT has actually declined by ~1% compounded annually since 2011.
Even if NPO can improve margins to 6.3% (average since 2011 and above TTM margins of 5.9%) and grow NOPAT by 4% compounded annually for the next decade, the stock is worth just $46/share today – a 36% downside. See the math behind this dynamic DCF scenario.
Critical Details Found in Financial Filings by Our Robo-Analyst Technology
As investors focus more on fundamental research, research automation technology is needed to analyze all the critical financial details in financial filings. Below are specifics on the adjustments we make based on Robo-Analyst findings in EnPro Industries’ 2017 10-K:
Income Statement: we made $663 million of adjustments, with a net effect of removing $455 million in non-operating income (35% of revenue). We removed $559 million in non-operating income and $104 million in non-operating expenses. You can see all the adjustments made to NPO’s income statement here.
Balance Sheet: we made $729 million of adjustments to calculate invested capital with a net decrease of $187 million. One of the largest adjustments was $310 million due to midyear acquisitions. This adjustment represented 19% of reported net assets. You can see all the adjustments made to NPO’s balance sheet here.
Valuation: we made $574 million of adjustments with a net effect of decreasing shareholder value by $534 million. The largest adjustment to shareholder value was $531 million in total debt, which includes $43 million in off-balance sheet operating leases. This lease adjustment represents 3% of NPO’s market cap.
This article originally published on August 8, 2018.
Disclosure: David Trainer, Kyle Guske II, and Sam McBride receive no compensation to write about any specific stock, style, or theme.
Follow us on Twitter, Facebook, LinkedIn, and StockTwits for real-time alerts on all our research.
[1] Harvard Business School features the powerful impact of our research automation technology in the case New Constructs: Disrupting Fundamental Analysis with Robo-Analysts.
[2] Ernst & Young’s recent white paper “Getting ROIC Right” proves the superiority of our holdings research and analytics.