
Recap From January’s Picks
Our Most Attractive Stocks (+1.2%) outperformed the S&P 500 (+0.7%) from January 6, 2021 through February 1, 2021 by 0.5%. The best performing large cap stock gained 18% and the best performing small cap stock was up 47%. Overall, 15 out of the 40 Most Attractive stocks outperformed the S&P 500.
Our Most Dangerous Stocks (+3.5%) underperformed the S&P 500 (+0.7%) as a short portfolio from January 6, 2021 through February 1, 2021 by 2.8%. The best performing large cap stock fell by 15% and the best performing small cap stock fell by 12%. Overall, 14 out of the 27 Most Dangerous stocks outperformed the S&P 500 as shorts.
The Most Attractive/Most Dangerous Model Portfolios underperformed as an equal-weighted long/short portfolio by 1.2%.
More reliable & proprietary fundamental data, proven in The Journal of Financial Economics , drives our research. Our proprietary Robo-Analyst Technology[1] scales our forensic accounting expertise (featured in Barron's ) across thousands of stocks[2] to produce an unrivaled database of fundamental data.
Sixteen new stocks make our Most Attractive list this month, and no new stocks fall onto the Most Dangerous list this month. February’s Most Attractive and Most Dangerous stocks were made available to members on February 3, 2021.
Our Most Attractive stocks have high and rising returns on invested capital (ROIC) and low price to economic book value ratios. Most Dangerous stocks have misleading earnings and long growth appreciation periods implied by their market valuations.
Most Attractive Stocks Feature for February: eBay Inc. (EBAY: $62/share)
eBay Inc. is the featured stock from February’s Most Attractive Stocks Model Portfolio.
eBay has grown revenue by 4% compounded annually and net operating profit after-tax (NOPAT) by 5% compounded annually over the past five years.
The firm’s NOPAT margin increased slightly from 22% in 2015 to 23% in 2020 while its invested capital turns improved more strongly from 0.7 to 1.2 over the same period. The combination of rising margins and invested capital turns drive eBay’s ROIC from 16% in 2015 to 28% in 2020. eBay’s profitability helps the firm generate significant free cash flow (FCF). Since 2015, the firm generated $17.7 billion (42% of market cap) in cumulative FCF.
Since most investors do not analyze balance sheets or measure invested capital turns, eBay’s improvement in profitability has yet to be impounded by the market.
Figure 1: Revenue & NOPAT Since 2015
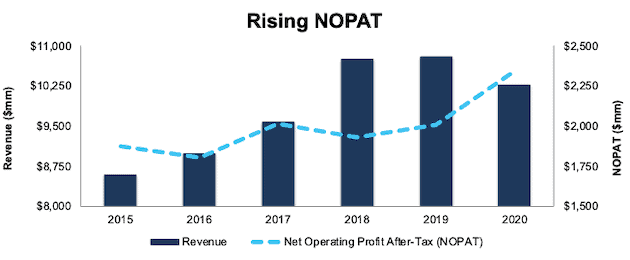
Sources: New Constructs, LLC and company filings
eBay Is Undervalued
At its current price of $62/share, EBAY has a price-to-economic book value (PEBV) ratio of 0.7. This ratio means the market expects eBay’s NOPAT to permanently decline by 30%. This expectation seems overly pessimistic for a firm that has grown NOPAT by 5% compounded annually over the past five years and 3% compounded annually over the past decade.
Even if eBay’s NOPAT margin falls to its 10-year average of 19% (compared to 23% in 2020) and the firm grows revenue by 1% compounded annually (equal to eBay’s 10-year revenue compound annual growth rate) for the next decade, the stock is worth $81/share today – a 31% upside. See the math behind this reverse DCF scenario. In this scenario, eBay’s NOPAT would fall by 1% compounded annually over the next decade. Should the firm achieve higher margins or faster revenue growth, the upside would be even greater.
Critical Details Found in Financial Filings by Our Robo-Analyst Technology
Fact: we provide more reliable fundamental data and earnings models – unrivaled in the world.
Proof: Core Earnings: New Data & Evidence, forthcoming in The Journal of Financial Economics.
Below are specifics on the adjustments we make based on Robo-Analyst findings in eBay’s 10-K:
Income Statement: we made $4.5 billion of adjustments, with a net effect of removing $3.3 billion in non-operating income (32% of revenue). You can see all the adjustments made to eBay’s income statement here.
Balance Sheet: we made $12.8 billion of adjustments to calculate invested capital with a net decrease of $6.5 billion. One of the largest adjustments was $3.5 billion in deferred tax assets. This adjustment represented 23% of reported net assets. You can see all the adjustments made to eBay’s balance sheet here.
Valuation: we made $13.9 billion of adjustments with a net impact of decreasing shareholder value by $3.8 billion. Apart from total debt, the most notable adjustment to shareholder value was $4.3 billion in excess cash. This adjustment represents 10% of eBay’s market cap. See all adjustments to eBay’s valuation here.
Most Dangerous Stocks Feature: Teradata Corp (TDC: $47/share)
Teradata Corp (TDC) is the featured stock from February’s Most Dangerous Stocks Model Portfolio. We reiterated Teradata as a Danger Zone pick in January 2021 in our report Outperforming Shorts That Could Fall Further.
While Teradata’s GAAP net income improved from -$67 million in 2017 to $105 million TTM, the firm’s economic earnings, the true cash flows of the business, fell from -$18 million to -$88 million over the same time, per Figure 2. The firm’s NOPAT margin fell from 4% in 2017 to <1% TTM and ROIC fell from 6% to <1% over the same time. As highlighted in Figure 2, Teradata’s GAAP net income misleads investors about the firm’s profitability.
Figure 2: Misleading GAAP Net Income vs. Economic Earnings
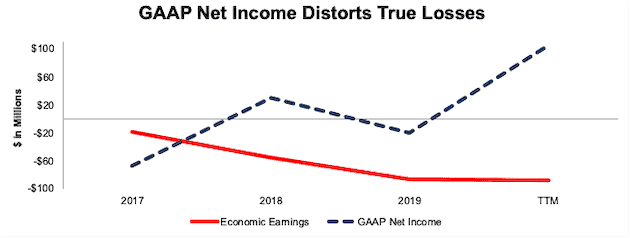
Sources: New Constructs, LLC and company filings
TDC Provides Poor Risk/Reward
Despite its poor fundamentals, TDC is still priced for significant profit growth and is overvalued.
To justify its current price of $47/share, Teradata must immediately achieve a 12% NOPAT margin (double the firm’s 5-year average of 6%) and grow NOPAT by 31% compounded annually for the next decade. See the math behind this reverse DCF scenario. This expectation seems overly optimistic given the firm’s NOPAT has fallen from $82 million in 2017 to $3 million TTM.
Even if Teradata can improve its NOPAT margin to 6% (vs. <1% TTM) and grow NOPAT by 21% compounded annually for the next 10 years, the stock is worth just $18/share today, a 62% downside to the current stock price. See the math behind this reverse DCF scenario.
Each of these scenarios also assumes Teradata is able to grow revenue, NOPAT, and FCF without increasing working capital or fixed assets. This assumption is unlikely but allows us to create best-case scenarios that demonstrate how high expectations embedded in the current valuation are.
Critical Details Found in Financial Filings by Our Robo-Analyst Technology
Fact: we provide more reliable fundamental data and earnings models – unrivaled in the world.
Proof: Core Earnings: New Data & Evidence, forthcoming in The Journal of Financial Economics.
Below are specifics on the adjustments we make based on Robo-Analyst findings in Teradata’s 10-K and 10-Q’s:
Income Statement: we made $67 million of adjustments, with a net effect of removing $43 million in in non-operating expenses (2% of revenue). You can see all the adjustments made to Teradata’s income statement here.
Balance Sheet: we made $1.3 billion of adjustments to calculate invested capital with a net increase of $316 million. One of the largest adjustments was $566 million in asset write-downs. This adjustment represented 48% of reported net assets. You can see all the adjustments made to Teradata’s balance sheet here.
Valuation: we made $1.3 billion of adjustments with a net effect of decreasing shareholder value by $394 million. Apart from total debt, the most notable adjustment to shareholder value was $441 million in excess cash. This adjustment represents 9% of Teradata’s market cap. See all adjustments to Teradata’s valuation here.
This article originally published on February 12, 2021.
Disclosure: David Trainer, Kyle Guske II, Alex Sword, and Matt Shuler receive no compensation to write about any specific stock, style, or theme.
Follow us on Twitter, Facebook, LinkedIn, and StockTwits for real-time alerts on all our research.
[1] Harvard Business School features our research automation technology in the case Disrupting Fundamental Analysis with Robo-Analysts.
[2] See how our models overcome flaws in Bloomberg and Capital IQ’s (SPGI) analytics in the detailed appendix of this paper.