
Recap From December’s Picks
Our Most Attractive Stocks (+2.2%) underperformed the S&P 500 (+4.8%) from December 2, 2021 through January 3, 2022 by 2.6%. The best performing large cap stock gained 11% and the best performing small cap stock was up 16%. Overall, 13 out of the 40 Most Attractive stocks outperformed the S&P 500.
Our Most Dangerous Stocks (+2.1%) outperformed the S&P 500 (+4.8%) as a short portfolio from December 2, 2021 through January 3, 2022 by 2.7%. The best performing large cap short stock fell by 17% and the best performing small cap short stock fell by 22%. Overall, 23 out of the 38 Most Dangerous stocks outperformed the S&P 500 as shorts.
The Most Attractive/Most Dangerous Model Portfolios outperformed as an equal-weighted long/short portfolio by 0.1%.
More reliable & proprietary fundamental data, proven in The Journal of Financial Economics, drives our research and provides investors with a new source of alpha. Our proprietary Robo-Analyst Technology[1] scales our forensic accounting expertise (featured in Barron's ) across thousands of stocks[2] to produce an unrivaled database of fundamental data.
Six new stocks make our Most Attractive list this month, and four new stocks fall onto the Most Dangerous list. January’s Most Attractive and Most Dangerous stocks were made available to members on January 5, 2022.
Our Most Attractive stocks all share a high and rising return on invested capital (ROIC) and low price to economic book value ratio. Most Dangerous stocks have misleading earnings and long growth appreciation periods implied by their market valuations.
Most Attractive Stocks Feature for January: Hillenbrand Inc. (HI: $51/share)
Hillenbrand Inc. (HI) is the featured stock from January’s Most Attractive Stocks Model Portfolio.
Hillenbrand has grown revenue by 13% compounded annually and net operating profit after-tax (NOPAT) by 17% compounded annually over the past five years.
The company’s NOPAT margin increased from 10% in fiscal 2016 (FYE is 9/30) to 12% in fiscal 2021, while invested capital turns rose from 0.86 to 0.94 over the same period. Rising margins and improved invested capital turns drove Hillenbrand’s ROIC from 9% in fiscal 2016 to 11% in fiscal 2021.
Figure 1: Revenue & NOPAT Since Fiscal 2016
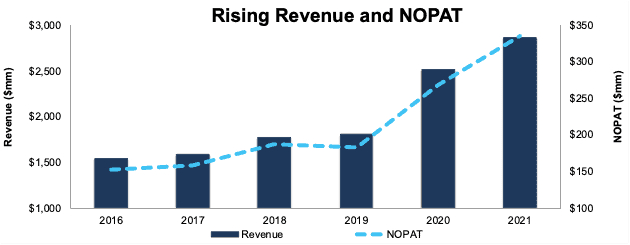
Sources: New Constructs, LLC and company filings
Hillenbrand Is Undervalued
At its current price of $51/share, HI has a price-to-economic book value (PEBV) ratio of 0.8. This ratio means the market expects Hillenbrand’s NOPAT to permanently decline by 20%. This expectation seems overly pessimistic for a company that has grown NOPAT by 11% compounded annually over the past decade.
Even if Hillenbrand’s NOPAT margin falls to 11% (equal to three-year average, compared to 12% in fiscal 2021) and the company’s NOPAT grows by just 2% compounded annually for the next decade, the stock is worth $68/share today – a 33% upside. See the math behind this reverse DCF scenario. Should Hillenbrand grow profits more in line with historical levels, the stock has even more upside.
Critical Details Found in Financial Filings by Our Robo-Analyst Technology
Below are specifics on the adjustments we make based on Robo-Analyst findings in Hillenbrand’s 10-K:
Income Statement: we made $229 million in adjustments, with a net effect of removing $85 million in non-operating expenses (3% of revenue). You can see all the adjustments made to Hillenbrand’s income statement here.
Balance Sheet: we made $796 million in adjustments to calculate invested capital with a net increase of $22 million. One of the most notable adjustments was $190 million in asset write-downs. This adjustment represented 6% of reported net assets. You can see all the adjustments made to Hillenbrand’s balance sheet here.
Valuation: we made $2.1 billion of adjustments with a net effect of decreasing shareholder value by $1.4 billion. One of the most notable adjustments to shareholder value was $303 million in excess cash. This adjustment represents 4% of Hillenbrand’s market cap. See all adjustments to Hillenbrand’s valuation here.
Most Dangerous Stocks Feature: NeoGenomics, Inc. (NEO: $25/share)
NeoGenomics, Inc. (NEO) is the featured stock from January’s Most Dangerous Stocks Model Portfolio.
NeoGenomics’s economic earnings, the true cash flows of the business, fell from -$4 million in 2015 to -$100 million over the trailing-twelve-months (TTM). The company’s NOPAT margin fell from 0% in 2015 to -8% TTM, while ROIC fell from -1% to -4% over the same time.
Figure 2: Economic Earnings Since 2015
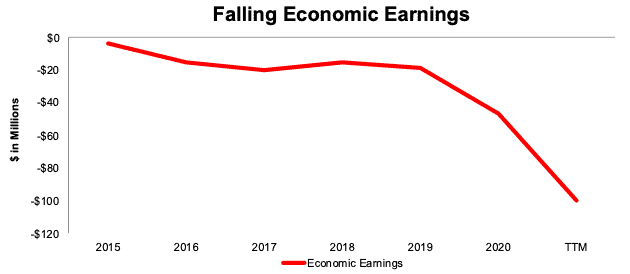
Sources: New Constructs, LLC and company filings
NeoGenomics Provides Poor Risk/Reward
Despite its poor fundamentals, NeoGenomics is priced for significant profit growth, and we believe the stock is overvalued.
To justify its current price of $25/share, NeoGenomics must improve its NOPAT margin to 5% (all-time high compared to -8% TTM) and grow revenue by 28% compounded annually for the next decade. See the math behind this reverse DCF scenario. In this scenario, NeoGenomics NOPAT in 2030 equals $240 million. Given that NeoGenomics’s NOPAT fell from $19 million in 2019 to -$37 million over the TTM, we think these expectations are overly optimistic.
Even if NeoGenomics can achieve a NOPAT margin of 5% and grow revenue by 15% compounded annually for the next decade, the stock is worth just $7/share today – a 72% downside to the current stock price. See the math behind this reverse DCF scenario. Should NeoGenomics’s revenue grow at a slower rate or NOPAT margins not recover to 2013 levels, the stock has even more downside.
Each of these scenarios also assumes NeoGenomics can grow revenue, NOPAT, and FCF without increasing working capital or fixed assets. This assumption is unlikely but allows us to create truly best-case scenarios that demonstrate how high expectations embedded in the current valuation are.
Critical Details Found in Financial Filings by Our Robo-Analyst Technology
Below are specifics on the adjustments we make based on Robo-Analyst findings in NeoGenomics’s 10-K and 10-Qs:
Income Statement: we made $43 million in adjustments, with a net effect of removing $11 million in non-operating income (2% of revenue). You can see all the adjustments made to NeoGenomics’s income statement here.
Balance Sheet: we made $300 million in adjustments to calculate invested capital with a net decrease of $285 million. One of the most notable adjustments was $5 million in asset write-downs. This adjustment represented <1% of reported net assets. You can see all the adjustments made to NeoGenomics’s balance sheet here.
Valuation: we made $1.0 billion in adjustments, with a net decrease to shareholder value of $379 million. Apart from total debt, the most notable adjustment to shareholder value was $316 million in excess cash. This adjustment represents 10% of NeoGenomics’s market cap. See all adjustments to NeoGenomics’s valuation here.
This article originally published on January 14, 2022.
Disclosure: David Trainer, Kyle Guske II, and Matt Shuler receive no compensation to write about any specific stock, style, or theme.
Follow us on Twitter, Facebook, LinkedIn, and StockTwits for real-time alerts on all our research.
[1] Harvard Business School features our research automation technology in the case Disrupting Fundamental Analysis with Robo-Analysts.
[2] See how our models overcome flaws in Bloomberg and Capital IQ’s (SPGI) analytics in the detailed appendix of this paper.