
Recap from October’s Picks
Our Most Attractive Stocks (-2.6%) fell less than the S&P 500 (-6.4%) and outperformed as a long portfolio last month. The best performing large cap stock fell 0.5% and the best performing small cap stock was up 72%. Overall, 23 out of the 40 Most Attractive stocks outperformed the S&P 500 in October.
The best performing Most Dangerous large cap stock fell by 40% and the best performing Most Dangerous small cap stock fell by 31%. Overall, 20 out of the 40 Most Dangerous stocks outperformed the S&P 500 as shorts in October and 29 had negative returns.
The successes of these model portfolios highlight the value of our machine learning and AI Robo-Analyst technology[1], which helps clients fulfill the fiduciary duty of care and make smarter investments[2].
14 new stocks make our Most Attractive list this month, and 20 new stocks fall onto the Most Dangerous list this month. November’s Most Attractive and Most Dangerous stocks were made available to members on November 7, 2018.
Our Most Attractive stocks have high and rising returns on invested capital (ROIC) and low price to economic book value ratios. Most Dangerous stocks have misleading earnings and long growth appreciation periods implied by their market valuations.
Most Attractive Stocks Feature for November: Western Union (WU: $18/share)
Western Union (WU) is the featured stock from November’s Most Attractive Stocks Model Portfolio. WU was a featured Long Idea in September 2018 and remains undervalued.
As noted in our original report, WU’s reported profits understate the true profitability of the business. Trailing twelve month (TTM) after-tax profit (NOPAT) is up 18% over the prior TTM period. Since 2016, WU’s NOPAT margin has improved from 15% to 17% TTM while its ROIC increased from 21% to 23%.
Figure 1: WU Revenue & NOPAT Since 2016
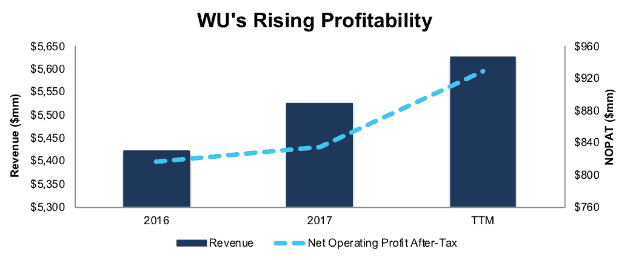
Sources: New Constructs, LLC and company filings
WU Valuation Provides Significant Upside
At its current price of $18/share, WU has a price-to-economic book value (PEBV) ratio of 0.7. This ratio means the market expects WU’s NOPAT will permanently decline by 30%. This expectation seems pessimistic for a company with Western Union’s track record of growth and profitability.
If Western Union can grow NOPAT by just 4.5% compounded annually for the next decade (benefitting from a reduction in its tax rate from ~25% to ~15%) the stock is worth $36/share today, a 100% upside from the current stock price. See the math behind this dynamic DCF scenario.
Critical Details Found in Financial Filings by Our Robo-Analyst Technology
As investors focus more on fundamental research, research automation technology is needed to analyze all the critical financial details in financial filings. Below are specifics on the adjustments we make based on Robo-Analyst findings in Western Union’s fiscal 2017 10-K:
Income Statement: we made $1.4 billion of adjustments, with a net effect of removing $1.4 million in non-operating expense (25% of revenue). You can see all the adjustments made to WU’s income statement here.
Balance Sheet: we made $1.9 billion of adjustments to calculate invested capital with a net increase of $244 million. The most notable adjustment was $655 million in excess cash. This adjustment represented 21% of reported net assets. You can see all the adjustments made to WU’s balance sheet here.
Valuation: we made $4.4 billion of adjustments with a net effect of decreasing shareholder value by $3 billion. Apart from the $655 million in excess cash noted above, the most notable adjustment was $3.5 billion in total debt, including $219 million in off-balance sheet debt. This off-balance sheet adjustment represents 3% of WU’s market cap.
Most Dangerous Stocks Feature: Blackbaud Inc. (BLKB: $70/share)
Blackbaud Inc. (BLKB) is the featured stock from November’s Most Dangerous Stocks Model Portfolio. Blackbaud was in the Danger Zone in April 2016 and has outperformed (+13% vs. S&P +33%) as a short position since then.
Since 2011, BLKB’s revenue has grown 13% compounded annually while economic earnings, the true cash flows of the business, have fallen from $25 million to -$15 million TTM.
Figure 2: BLKB’s Disconnect Between Revenue and Economic Earnings
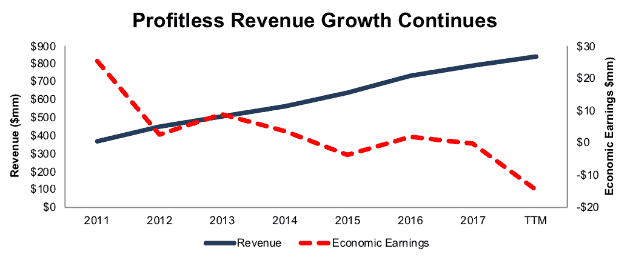
Sources: New Constructs, LLC and company filings
BLKB Provides Poor Risk/Reward
The market is finally catching on to BLKB’s poor fundamentals, and the stock is down 26% year-to-date. However, even after this price decline, shares remain significantly overvalued.
To justify its current price, BLKB must maintain NOPAT margins (8%) and grow NOPAT by 15% compounded annually for the next 16 years. See the math behind this dynamic DCF scenario. This expectation seems lofty given that BLKB has failed to create shareholder value over the past five years despite significant revenue growth.
Even if the company can maintain current margins and grow NOPAT by 7% compounded annually for the next decade, the stock is worth just $14/share today – an 80% downside. See the math behind this dynamic DCF scenario.
Critical Details Found in Financial Filings by Our Robo-Analyst Technology
As investors focus more on fundamental research, research automation technology is needed to analyze all the critical financial details in financial filings. Below are specifics on the adjustments we make based on Robo-Analyst findings in Blackbaud’s 2017 10-K:
Income Statement: we made $62 million of adjustments, with a net effect of removing $2 million in non-operating income (<1% of revenue). You can see all the adjustments made to BLKB’s income statement here.
Balance Sheet: we made $297 million of adjustments to calculate invested capital with a net increase of $43 million. One of the largest adjustments was $126 million due to midyear acquisitions. This adjustment represented 16% of reported net assets. You can see all the adjustments made to BLKB’s balance sheet here.
Valuation: we made $604 million of adjustments with a net effect of decreasing shareholder value by $604 million. There were no adjustments that increased shareholder value. The largest adjustment to shareholder value was $550 million in total debt, which includes $125 million in off-balance sheet operating leases. This lease adjustment represents 4% of BLKB’s market cap.
This article originally published on November 14, 2018.
Disclosure: David Trainer and Kyle Guske II receive no compensation to write about any specific stock, style, or theme.
Follow us on Twitter, Facebook, LinkedIn, and StockTwits for real-time alerts on all our research.
[1] Harvard Business School features the powerful impact of our research automation technology in the case New Constructs: Disrupting Fundamental Analysis with Robo-Analysts.
[2] Ernst & Young’s recent white paper “Getting ROIC Right” proves the superiority of our holdings research and analytics.