
General Electric (GE: $31/share) is overvalued compared to its peers and relative to the firm’s current profitability.
Thesis: Management can stem the potential loss of value, or even create value in the amounts below[1] by aligning the firm’s strategy and performance compensation with real cash flows or what we call return on invested capital (ROIC).
Our thesis is predicated on the ideas that (a) real cash flows matter and (b) superior profitability is ultimately rewarded by the market.
While these ideas are by no means new, they are underappreciated these days for a variety of reasons, including the difficulty in applying them with scale. Nevertheless, if you think cash flow matters, we expect you will find our thesis on GE and ROIC compelling. We believe our proposals are very reasonable and GE’s management is well positioned to realize the potential value of implementing our proposals.
Figure 1: Value Creation Potential for GE Management
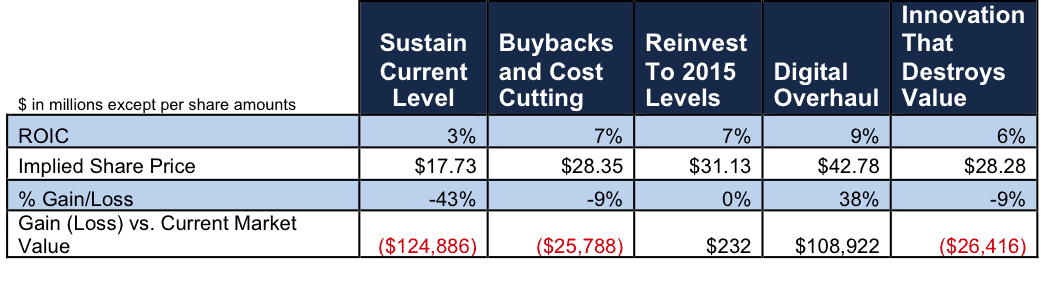
Sources: New Constructs, LLC and company filings.
We support our thesis by showing:
- How overvalued GE is relative to real cash flows and ROIC
- How to ensure the market rewards a higher ROIC
- Targeted proposals on how management can improve ROIC
- How to quantify the consequences if management fails to improve ROIC
How Overvalued Is GE?
We find the relationship between ROIC and stock valuation intuitive. Over the long term, the market assigns the most value per dollar invested to the companies that produce the most cash per capital invested. Statistical analysis (see Figure 2 and additional Figures in Appendix B) shows that the biggest driver of stock valuation is, by far, ROIC.
Figure 2 also shows that GE is among the most expensive of its peers and that ROIC explains 88% of the changes in stock valuation for GE and its peers[2].
Figure 2: GE Is Overvalued Compared To Peers
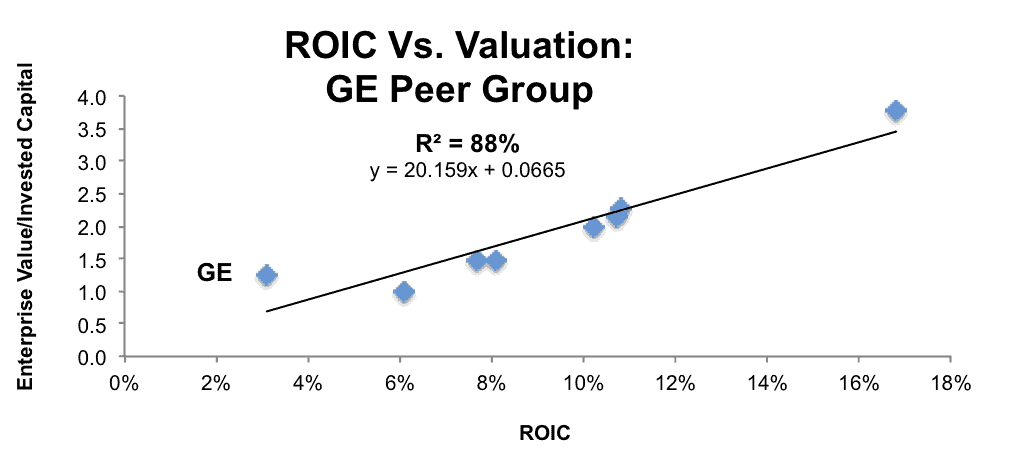
Sources: New Constructs, LLC and company filings.
In Appendix B, we provide further evidence for the explanatory power of ROIC and stock market valuations.
So What Is the Stock Worth?
Based on the linear equation from Figure 2, the stock is worth ~$18/share if we assume that GE can maintain its current ROIC of 3% and not accelerate growth. That downside translates into a loss of $125 billion in market cap or $13 per share (43%) for investors.
The other way to interpret Figure 2 is to assess what the stock market is telling us by valuing GE at $31/share. By assigning GE an Enterprise Value/Invested Capital (a cleaner version of price-to-book) ratio of 1.26, the market is saying that it believes GE’s ROIC will permanently increase to 6%[3], or that the company’s (profitable[4]) growth will accelerate, or some combination of both.
The strong correlation between ROIC and GE’s stock price shows there is big downside for shareholders if management can’t achieve the improvement in ROIC or growth that is already expected.
Such an achievement is not easy and requires a shift in focus toward better capital allocation discipline, not something the markets have seemed to care about. The prevailing focus of the stock market over the last several years has been on more technical measures of stock price performance. On the rare occasions when fundamentals are a topic of conversation, they are usually discussed in terms of non-GAAP cash flow or earnings per share (EPS) instead of ROIC.
There has been a lack of focus by the markets on long-term, rigorous fundamental research for some time. As a result, most management teams focus instead on what analysts and investors ask for.
This opens the door for those managers who want to be ahead of the curve and earn premium valuations by focusing on ROIC. If you don’t buy into the regression above, then Figure 3 should convince you of the importance of ROIC for GE. The strength of the relationship between ROIC and valuation up until recently is evident.
Figure 3: ROIC Is Highly Correlated With GE’s Valuation
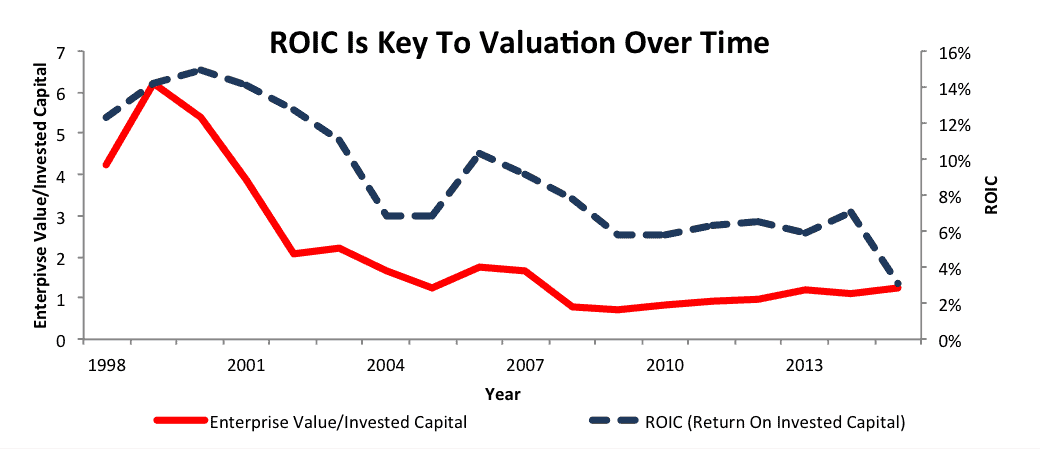
Sources: New Constructs, LLC and company filings.
Have Markets Lost Focus On ROIC?
As Figure 3 shows, GE’s valuation and ROIC moved along similar trajectories up until 2015, when ROIC declined dramatically while the stock’s valuation stayed constant. That led to the disconnect in Figure 1, where GE appears to be significantly overvalued compared to its peers.
We can easily understand this disconnect by looking at the significant overhaul undertaken by CEO Jeffrey Immelt. He has begun selling and spinning off a significant portion of GE Capital, the company’s financial arm. GE Capital has generated significant profits in the past, but it also adds a great deal of risk for the company. The designation of GE Capital as a “systematically important financial institution” opened up the company to a massive amount of regulatory scrutiny and bigger capital commitments.
Getting rid of GE Capital sacrifices short-term profits, but it also could make future cash flows more stable while giving the company the resources and freedom to focus on its core industrial competencies. In addition to getting rid of financial assets, Immelt has focused on entrenching GE in the “Industrial Internet of Things” (IIot). The unveiling of its Predix Cloud platform for industrial applications is the first step in his goal to make GE one of the 10 largest software providers in the world.
Clearly, investors have faith that 2015’s drop in ROIC is a short-term blip for GE. The case for GE commanding its current premium comes from two assumptions:
- GE can restore the ROIC of its existing business back to at least the 6-7% level of 2009-2014.
- The proceeds from the sale of GE Capital assets and the opportunity from the IIoT will give GE the ability to invest significantly in growth, allocating new capital intelligently at a rate of return above its current weighted average cost of capital (WACC) of 7%.
Right now, these hypothetical scenarios seem to control the narrative. Investors have been willing to dismiss lackluster 2015 results as part of a transitional period. However, if GE cannot quickly show that its decisions are helping to restore ROIC and return the company to growth, the market might begin to view the current level of profitability as the “new normal”, an outcome that leads to significant shareholder losses.
- How to ensure the market rewards the focus on ROIC
We believe the majority of sophisticated investors would enthusiastically welcome a return of focus on ROIC by management teams. In the mid 1990s, there was a large movement in the corporate community to focus on shareholder value. Unfortunately, this movement was overshadowed by the tech bubble and has never really recovered.
To get credit for focusing on ROIC, management needs to effectively communicate this shareholder value-based strategy to the investment community and show they are dedicated to it.
Investors are looking for four things when assessing management’s focus on ROIC:
a. Leadership: the focus on ROIC needs to start at the top, with the CEO. If the boss doesn’t back the plan, then it is hard to believe that everyone else will.
b. Tie to capital budgeting: every capital allocation decision needs to pass the “Net Present Value” test, which measures whether ROIC is greater than WACC, i.e. expected cash flows are high enough to cover all costs, including the cost of equity capital.
c. Tie to compensation: linking compensation to ROIC shows management wants to be accountable for the real drivers of valuation and sends a strong message about its priorities.
d. Communication: In addition to highlighting EPS growth, revenues, and other traditional metrics, management should highlight ROIC and how it is driving improvement of that metric.
Indeed, showing a clear link between management’s strategy and creating value for shareholders will likely compare well to the typical Wall Street road show. The more detailed that management can be about how it is driving a focus on ROIC through the organization, the more it can impress investors and the more likely it can earn a premium valuation.
We think investors would be impressed by a management presentation with an emphasis on improving ROIC over the long term, as they were when Google became Alphabet.
We also think the size of the prize is large enough to warrant management’s attention. Below, we provide a framework for articulating to investors how management can drive increases in ROIC.
- Targeted proposals on how management can improve ROIC and how much value that creates
Figure 1 shows the impact on the stock according to four different levels of ROIC. The first scenario was covered above when we showed the stock price decrease that results from the market believing GE’s 3% ROIC or profitable growth cannot be improved. The other three scenarios are based on management implementing the specific operational proposals below[5].
The overriding principle here is that management should focus on maximizing future free cash flow. ROIC is not the only driver of future free cash flow, though it is the most important, by far. There is significant upside to GE if management can achieve improvement in all drivers of free cash flow, which we list below.
- Increase ROIC[6].
- Extend the Growth Appreciation Period (GAP). This driver is also known as the Competitive Advantage Period (CAP). It links strategy to valuation and is measured with a dynamic discounted cash flow model.
- Increase revenue growth. This driver is last because it does not add value if the company’s ROIC is not above its WACC[7]. Top line growth is all too often the primary focus of investor attention when it should always be secondary to ROIC.
Per Figure VI in Appendix C, we can break each of these drivers down into more discrete elements of a business. As outsiders, we cannot go as deep as management or consulting partners. However, we recommend management show investors how they directly link the most discrete elements of the business to Free Cash Flow growth. This analysis should apply to each business line or division within a firm as well as the overall firm.
Recommendations for Increasing Free Cash Flow and Creating Shareholder Value
A. Increase ROIC:
We begin by breaking down ROIC into its prime components – NOPAT Margin and Invested Capital Turnover – so we can provide more targeted advice.
I. NOPAT Margin: Remove Inefficient And Redundant Spending
GE has targeted significant cost reductions throughout its various units over the next year, especially in the oil and gas business. To compensate for the downturn in the industry, GE wants to cut $800 million in costs in 2016.
This will come in the form of consolidating factory and service center space, improving operating efficiency, negotiating better terms with suppliers, and cutting some overhead. It also plans to cut 6,500 jobs as part of a restructuring plan to eliminate overlapping expenses after its $14 billion acquisition of Alstom’s energy business.
Even accounting for the fact that GE’s tax burden should be lower going forward now that the bulk of the GE Capital divestment has been completed, the company still has significant room for improvement on the margin front. It’s pre-tax (NOPBT) margins were 10.6% in 2015 compared to 14.1% the year before.
II. Capital Turnover: Better Working Capital Management
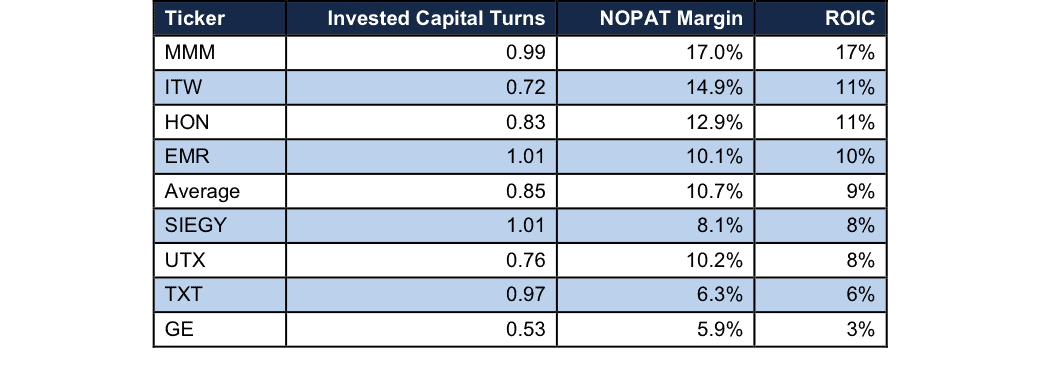
As Figure 6 shows, GE ranks significantly behind the rest of its peers in terms of capital turnover. Unsurprisingly, it also ranks near the bottom on measures of working capital efficiency, such as Days in Inventory. In 2015 its average Days in Inventory was 71, significantly worse than competitors such as 3M Company (MMM) at 42.
In the next section, we’ll cover the impact of GE’s growing digital strategy. Needless to say, this strategy could have a significant impact on capital turnover, as software requires significantly less physical capital and can be sold more efficiently at scale. Still, GE could improve capital turns through better inventory management even without a major strategic shift.
B. Increase Revenue Growth
Within the discipline of improving ROIC, we can propose strategies for growing revenue. Growing revenue without regard to whether or not ROIC exceeds WACC can lead to shareholder value destruction. Per Figure VII in Appendix C, the company can grow revenue by selling into new markets or creating new products. These goals can be accomplished in many ways. The one way we recommend that management not grow the top line is by acquisition given the negative impact on ROIC.
GE’s renewed focus on its industrial capabilities has opened up new avenues for revenue growth by leveraging the company’s unique qualities. GE recently launched a new division, called Current, to help companies manage their energy needs. Current recently made waves by selling 1.4 million light bulbs to JPMorgan (JPM).
The Predix cloud underlies a lot of these new initiatives and could potentially open up a wide array of revenue generating opportunities. GE CFO Jeff Bornstein told analysts that the company’s ambition is for Predix to become “what iOS and Android have become to mobile telephony – one of the standard solution sets for the Industrial Internet.”
That’s an enormously ambitious goal, but if GE could execute on that strategy, it would have an interesting (and enviable) challenge of figuring out the best way to monetize such a valuable platform.
C. Extend Growth Appreciation Period (GAP)
Whereas revenue growth and ROIC can be measured concretely, GAP is harder to quantify. With the right tools, though, we can calculate the future cash flows required to justify a given stock price. Our dynamic DCF model gives us a “market-implied GAP” that shows how many years of profit growth the market embeds in share prices. This model also allows us to measure the concrete amount of value created or lost by extending or shortening GAP. While we can discretely measure the impact of GAP on valuation, we do not pretend we can predict what GAP will be. Ultimately, the length of GAP in the stock price will be a function of how well management can convince investors of its ability to sustain a high ROIC. Please refer to section “2. How to ensure the market rewards the focus on ROIC” for our proposal on how to communicate with investors.
Given GE’s long history, investors seem to be assigning it a healthy GAP even after its recent struggles. The company’s massive advantages in scale and resources, as well as its brand recognition, still garner investor respect.
However, investors won’t stay patient for long. Several years of low single-digit ROIC would be a clear sign that its advantages have eroded.
- How to quantify the size of the prize if management improves ROIC
As shown in Figure 1, GE faces a 40+% decline in price if it stays at 2015 levels of profitability. That scenario is not particularly plausible, as the massive sale of GE Capital assets during 2015 mean the business looks fundamentally quite a bit different today.
Scenarios 1-4 present a handful of more likely alternatives[8].
Scenario 1—Buybacks and Cost Cutting: Currently, the company has announced plans to buy back $50 billion in stock and cut $2.3 billion in costs. This plan is, clearly, not enough to satisfy the market. Here are the specifics on where we see the valuation of the stock is the company does not find a way to effectively redeploy the $75 billion in proceeds from the sale of the financial assets.
Cutting $2.3 billion in costs and making improvements to inventory management would enable the company to achieve NOPAT margins of 12.4% and slightly improved capital turnover of 0.58. That performance results in a big improvement to ROIC (7%). However, that improvement is not enough to offset the revenue lost in the sale of the financial assets and would lead to a stock price of $28/share, or a 9% drop ($26 billion decline in market value).
Scenario 2—Reinvest To 2015 Levels: If, instead of buying back stock, GE could quickly redeploy the capital from the sale of the financial assets and earn the same ROIC on that capital, it would generate enough cash flow to justify the current stock price. We recognize that such profitable investment opportunities do not grow on trees, and that the buy back suggests that management does not see an effective way to redeploy the assets in the foreseeable future. Nevertheless, this scenario is a simple approach to quantifying the cash flow performance expectations baked into the current stock price.
Scenario 3—Digital Overhaul: As mentioned above, GE’s digital transformation could open up a wide array of new business opportunities. In this most optimistic scenario, let’s assume GE doesn’t just get back to its average invested capital from 2015, but actually invests almost the entire portion of the GE Capital proceeds, nearly $75 billion, in expanding the Predix cloud and creating exciting new applications that radically improve industrial efficiency.
GE doesn’t need to earn an unbelievable ROIC to create significant value for shareholders. Our model for this scenario has GE generating $10.1 billion in NOPAT from ~$75 billion in these new software investments. That’s an ROIC of 14%. The average ROIC for software companies in the S&P 500 is 25%.
If we look at the company as a whole, this scenario gives GE a 15% NOPAT margin and 0.6 capital turnover, for an ROIC of 9%. That’s roughly what the company earned in 2007 and nothing compared to its profitability in the late 90’s and early 2000’s. Even still, a 9% ROIC at that level of invested capital would translate to a valuation of $43/share, or 38% higher than the current price. Total market value gains would be over $100 billion.
The key point of this proposal is that management must evaluate any new ventures or “innovations” through the lens of ROIC. Given the market’s current expectation for future ROIC, new investments in innovation must yield an ROIC of more than 6% to be accretive to shareholders.
Scenario 4—Innovation That Destroys Value: In this scenario, we analyze the impact of innovation efforts that are not guided by ROIC and shareholder value creation. To isolate the impact of misguided innovation efforts, we assume that the company can maintain a 7% ROIC on its existing business as implied in Scenario 1. In addition, the company invests nearly $80 billion in innovation that increases revenue by 15% over 2015. The NOPAT margin and capital turns both fall slightly, dragging ROIC down to 6% though NOPAT rises by $3.6 billion.
$3.6 billion in incremental profit divided by an $80 billion investment yields an ROIC of just 5%. This investment would decrease GE’s overall ROIC by about 80 basis points. As shown in Figure 4, profits might grow from the current level, but shareholder value would be less than if the firm invested nothing in innovation and focused solely on the existing business.
Figure 1 summarizes the value creation/loss potential for these four scenarios along with the value of maintaining the current level of ROIC. Appendix A Figure III has details behind all of these calculations.
Figure 4 goes one step further to analyze how management might consider compensating those that help execute the value-creating strategies. Rather than pay traditional rates and fees, one could propose a gain share model to ensure your consulting partners are aligned with increasing ROIC.
While the gain share model only really works well for Scenario 3 here, reducing the large pending shareholder losses implied by the status quo could be a significant selling point for consulting partners. Any steps consultants could take to help GE increase its ROIC would be extremely valuable, even if they aren’t enough to create a real increase in the current stock price.
Figure 4: Potential Market Value Gains Are Substantial
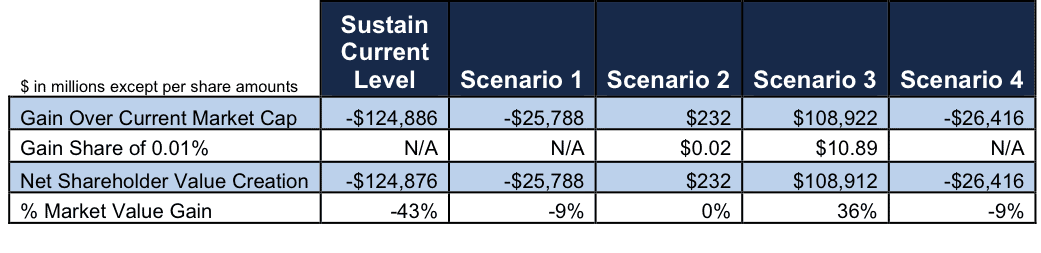
Sources: New Constructs, LLC and company filings. See Appendix B for details on calculations behind these results.
Note that in each of the scenarios above, we assume that GE will trade at par (on the regression trend line) with its peers based on its ROIC. The stock would warrant a premium valuation (above the trend line) by virtue of management’s focus on ROIC and its ability to communicate that focus to investors. Either way, we believe we have presented both a very achievable and meaningful opportunity for GE’s management to justify its current valuation and even deliver significant returns for investors.
Competitive Weakness Vs. Peers Shows Need For Improvement
As part of the process for developing specific recommendations on how management can drive free cash flow growth, we review how GE and its peers have performed on the drivers of this growth over the past ten years.
GE used to rank near the middle compared to other large industrial conglomerates for ROIC. Recently, however, it fell to the very bottom.
Figure 5: Relative Decline In ROIC
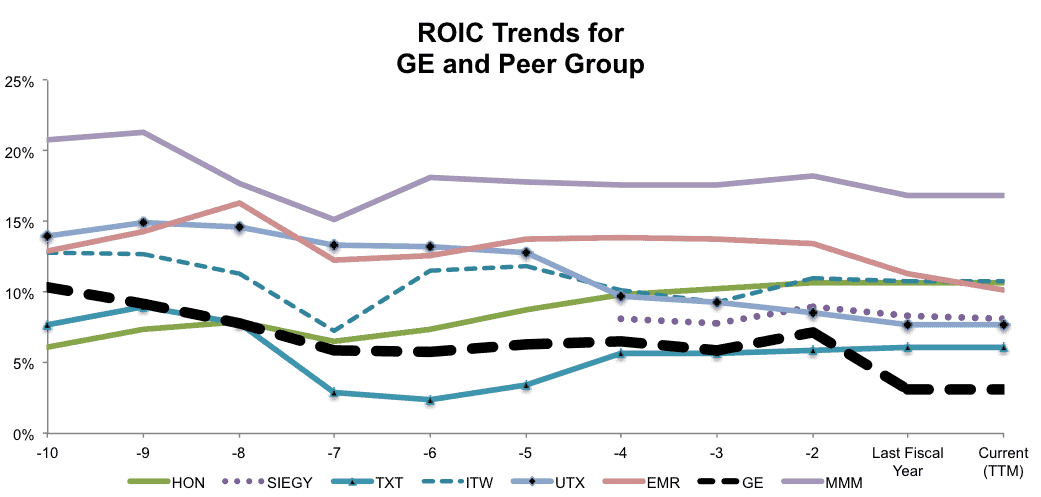
Sources: New Constructs, LLC and company filings.
Figure 6 shows that GE has consistently lagged behind its peers in terms of capital turnover.
Figure 6: GE Lags Behind Its Peers
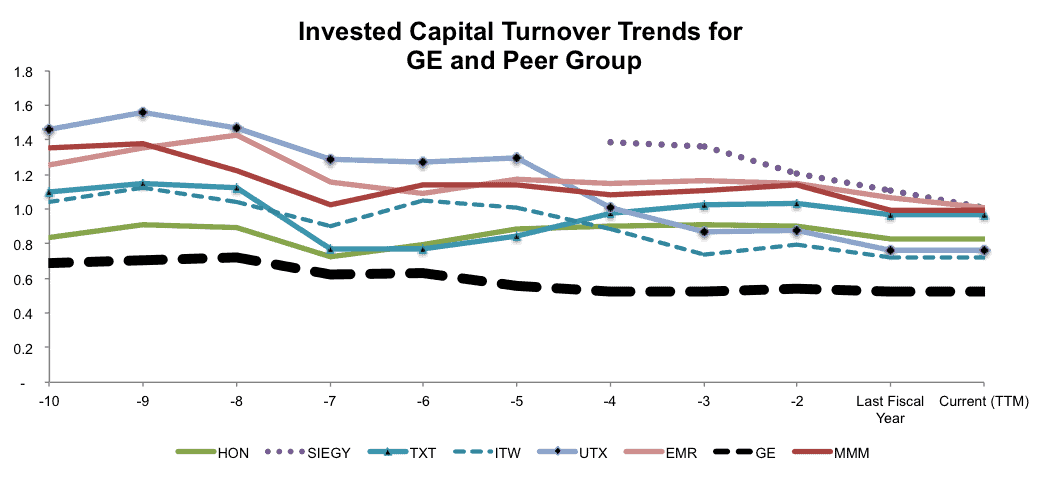
Sources: New Constructs, LLC and company filings.
On the other hand, GE’s brand and scale leverage used to help it achieve margins that were near the top of its peers. Restoring those margins after a disappointing 2015 should be a key priority for GE management.
Figure 7: Near The Bottom For Margins
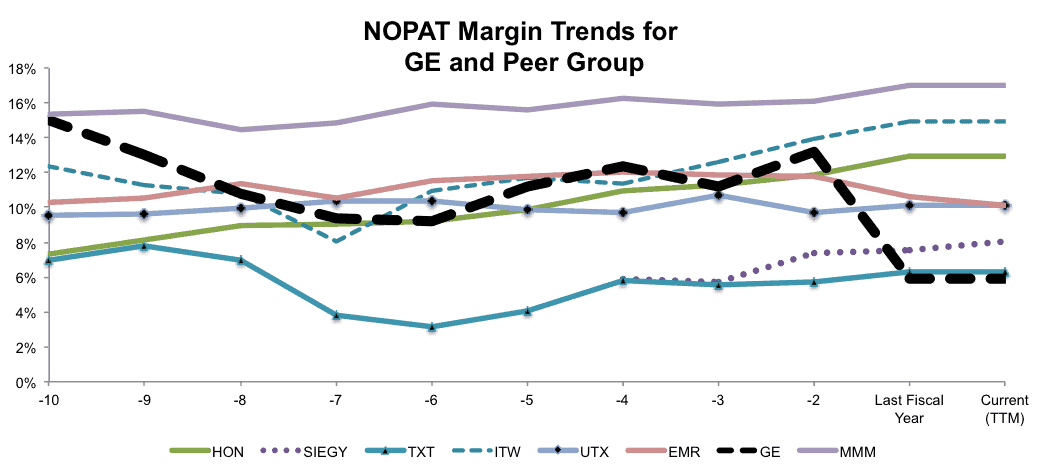
Sources: New Constructs, LLC and company filings.
GE’s large revenue decline in 2015 was mostly due to its divestment, but even if we stretch back over several years we see a consistent pattern of decline. The rest of the industry continues to struggle as well.
Figure 8: Growth Has Turned Negative
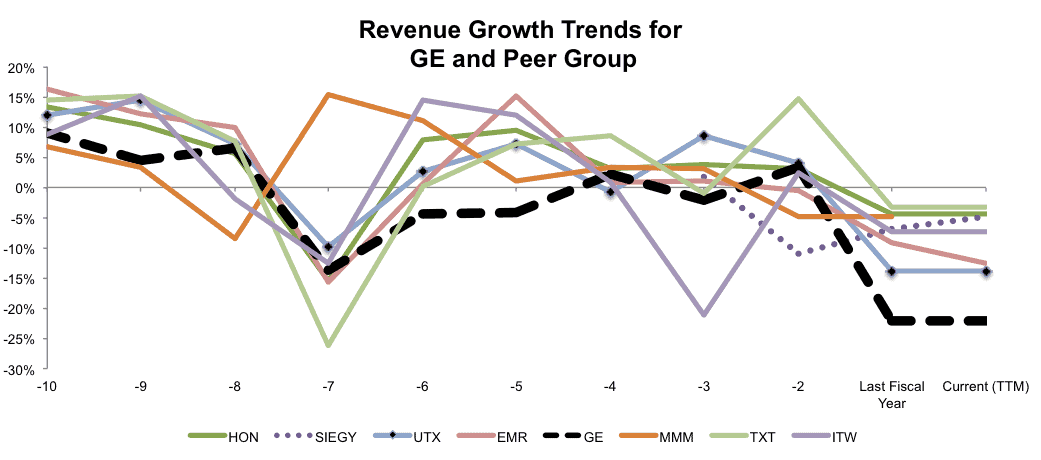
Sources: New Constructs, LLC and company filings.
As these charts show, GE has quite a bit of work to do to catch up to its peers
Figure 9 shows that GE ranks at the bottom of its peer group for ROIC and capital turns.
Figure 9: GE Is At The Bottom In All Categories
Sources: New Constructs, LLC and company filings.
Conclusion
GE’s impressive history has allowed it to maintain a valuation far above what its 2015 results would justify. The company needs to execute on the turnaround investors expect if it wants to avoid a substantial decline in its market value.
We’ve attempted to provide a very clear path forward for management along with a robust indication of how much value that path could create for shareholders.
While we cannot promise as large an increase as what GOOGL enjoyed last summer, if management were to signal a shift toward a more ROIC-centric strategy, we think GE could maintain its premium and even deliver significant returns to shareholders.
Disclosure: David Trainer and Sam McBride receive no compensation to write about any specific stock, sector, style, or theme.
Appendix A: Implied Values Based on Linear Equations from Regression Analyses
Figures I – III show how we calculate the implied share prices and ROIC based on the three regression analyses in this report. Click here for the original spreadsheets with all calculations and details.
Figure I: Implied Stock Price and Upside for GE Based on Linear Equations from Regressions
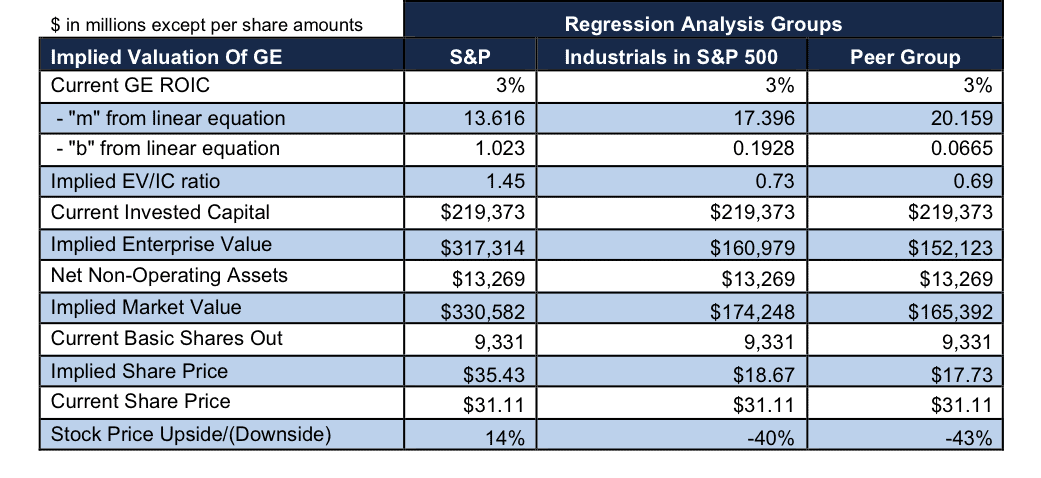
Sources: New Constructs, LLC and company filings.
Figure II: Implied ROIC for GE Based on Linear Equations from Regressions
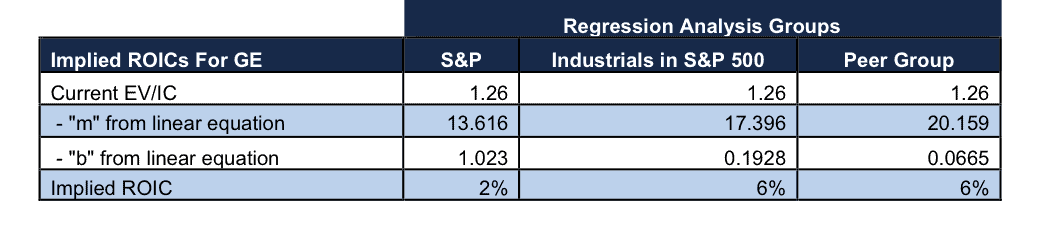
Sources: New Constructs, LLC and company filings.
Figure III: Implied Value Creation Scenario Details
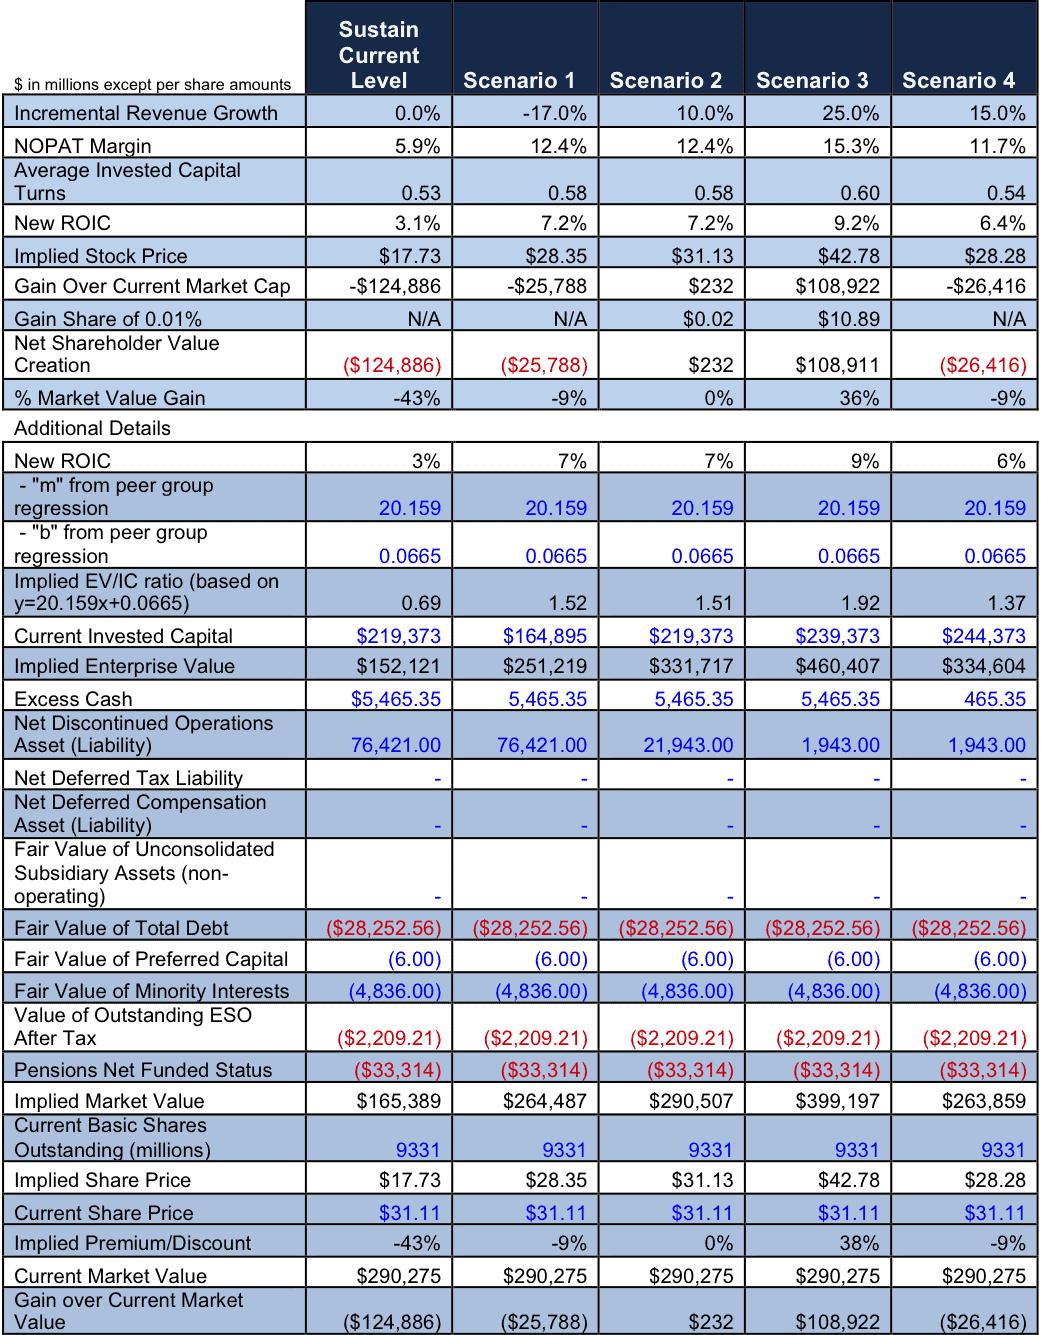
Sources: New Constructs, LLC and company filings.
Appendix B: More Regression Analyses Details
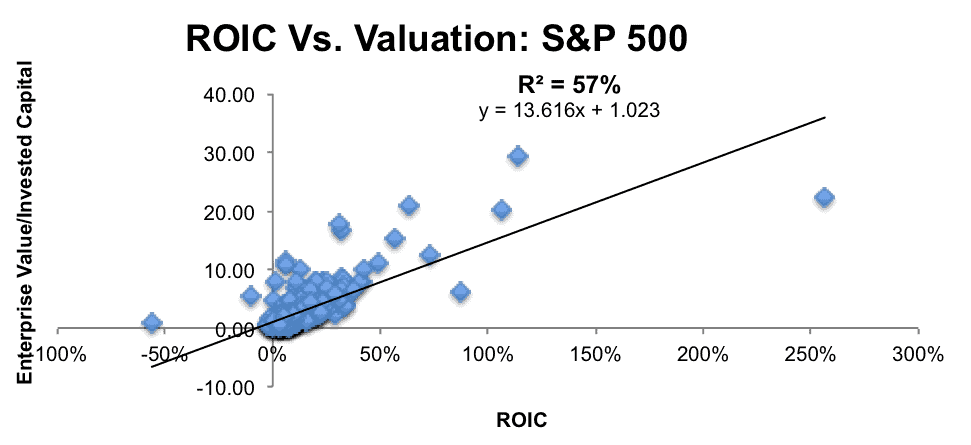
Figures IV and V show additional regressions of ROIC vs. Enterprise Value/Invested Capital (a cleaner version of price-to-book). The relationship between ROIC and valuation holds quite strongly on larger groups of stocks. Figure V shows that ROIC explains 57% of the changes in valuation for the stocks in the S&P 500.
Verify the data and regression analyses in the original spreadsheet here.
This regression framework for stock valuation was first introduced long ago by folks with much more impressive pedigrees than ours: McKinsey’s Valuation Handbook, Bennett Stewart’s Quest For Value, Credit Suisse’s Michael Mauboussin’s ROIC Patterns and Shareholder Returns. The innovation we bring to the table is modeling ROIC, free cash flow and GAP, etc. with scale.
Figure IV: ROIC Drives Valuations for the S&P 500
Sources: New Constructs, LLC and company filings.
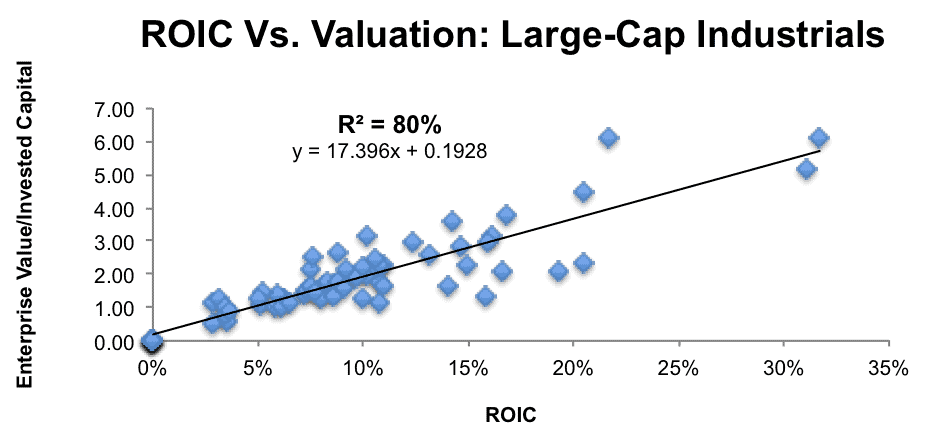
Figure V (r-squared is 80%) shows that the explanatory power of ROIC for stock prices remains strong when we narrow the focus to large cap financial stocks.
Figure V: GE Still Cheap Versus Other Financials
Sources: New Constructs, LLC and company filings.
Appendix C: Free Cash Flow Growth Breakdown
Figure VI: Drivers Of Free Cash Flow Growth
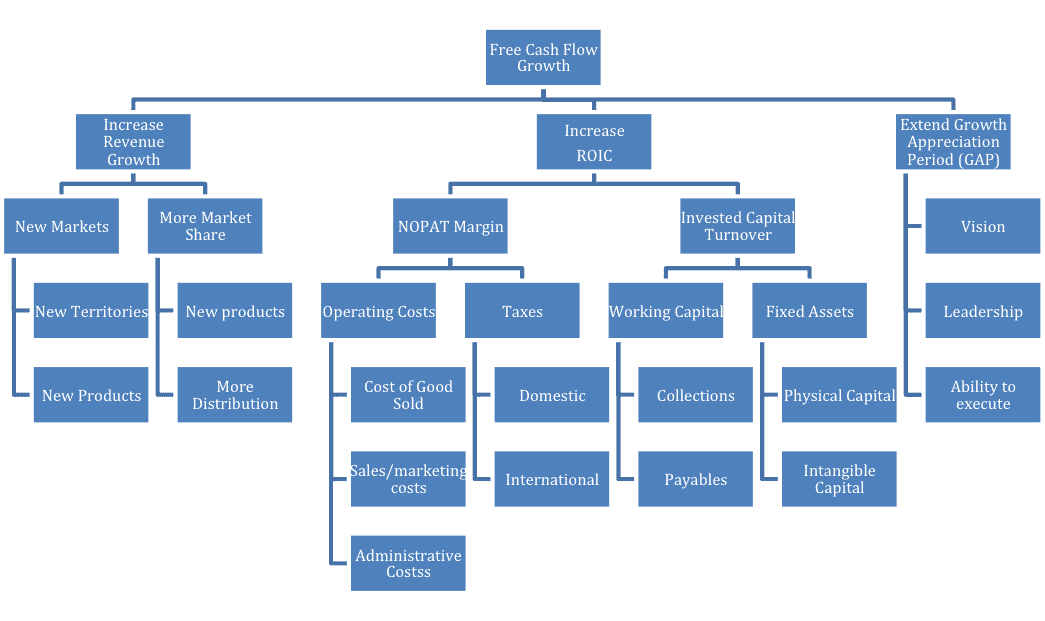
Sources: New Constructs, LLC and company filings.
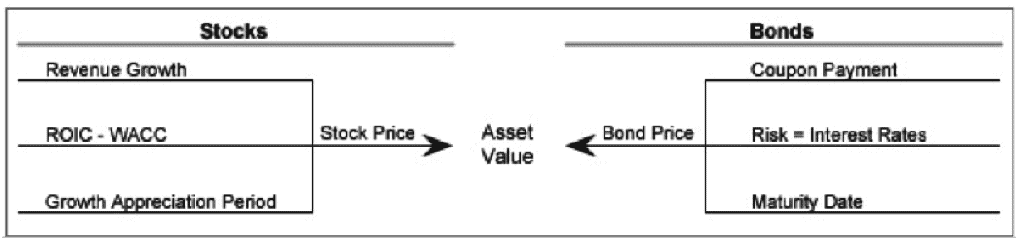
As discussed in our post, “How New Constructs’ Discounted Cash Flow Model Works,” stock valuations and bond valuations can be understood in the same way. For stocks, valuation is driven by revenue growth, ROIC, and GAP. For bonds, valuation is driven by coupon payments, risk, and maturity date. The Growth Appreciation Period (GAP) for stocks is analogous to the maturity date for a bond.
Figure VII: How To Price Stocks And Bonds
Sources: New Constructs, LLC and company filings.
Executives can increase shareholder value by proving to the market that the company has a sustainable competitive advantage and a longer GAP. In the context of the regression analysis, a longer or shorter GAP (relative to peers) manifests in a stock trading above or below the trend line.
Appendix D: Linking Enterprise Value to ROIC
ROIC and free cash flow all tie back to enterprise value as we show below in Figure IX. Click here for the original spreadsheets with all calculations and details.
Figure VIII: The Elements Of Enterprise Value
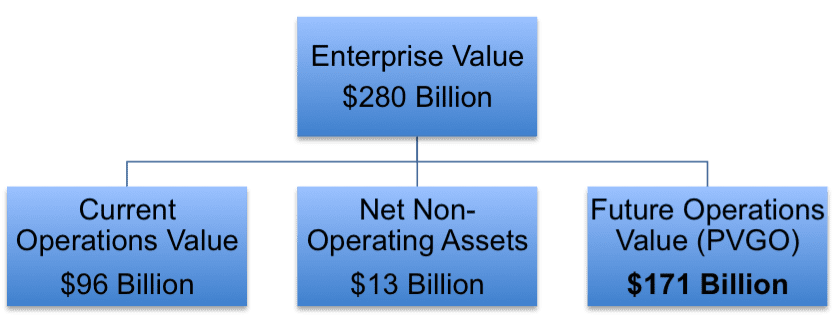
Sources: New Constructs, LLC and company filings.
- Current Operations Value is also known as the no-growth value of the business based on the assumption that cash flows never grow from current levels. We measure it by dividing current cash flows[9] by the cost of capital or NOPAT/WACC, and it equals $96 billion for GE. This calculation is also known as the perpetuity value of current cash flows or “pre-strategy value”.
- Net Non-Operating Assets for AXP equal $13 billion[10].
- Future Operations Value is also known as the Present Value of Future Growth Opportunities or “PVGO”. This value captures the impact of what management does for the future of a company. We measure it as Enterprise Value minus Current Operations Value and Non-Operating Assets.
A key benefit of breaking down the enterprise value per Figure VII is to bring into clear focus the importance of PVGO. Understanding that we cannot change the past, a clear focus on future operations is important. We are not saying that nothing can be done to improve current operations or net non-operating assets, and they should not be entirely overlooked. We are saying that the majority of focus should be on the future operations value because that element of enterprise value will, most likely, have the largest impact on the value of the business in the future.
Given the regression analyses showing that the market expects ROIC to permanently increase, we are not surprised to see that the PVGO is $171 billion[11].
Naturally, management’s focus should be primarily on PVGO. Figure VIII shows the drivers of PVGO, the most important of which is future free cash flow growth.
Looking at enterprise value from this perspective shows how the drivers of free cash flow drive enterprise value.
Figure VI in Appendix C takes the breakdown even further to show how to link even the most discrete parts of the business to free cash flow. We hope this details help support the rigor of our thesis as well as the ease of its implementation.
Figure IX: The Drivers Of Future Operations Value
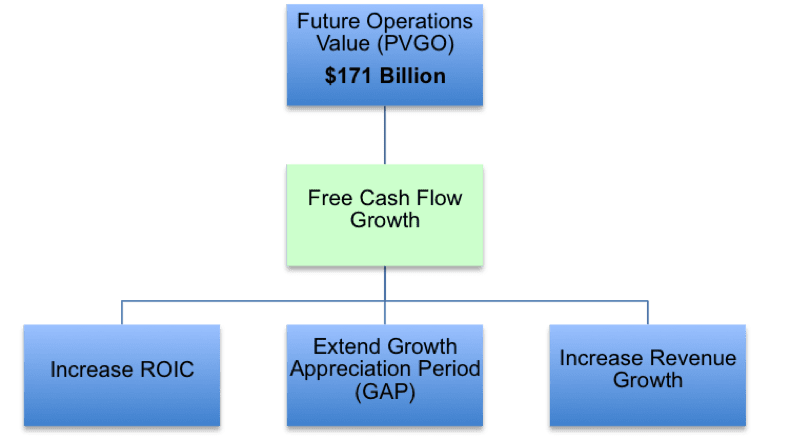
Sources: New Constructs, LLC and company filings.
While all three factors play an important role, ROIC is the most important factor. Revenue growth without an ROIC above WACC destroys shareholder value, and a consistently high ROIC is the strongest signal a company can send to the market that it has a sustainable competitive advantage and deserves a long GAP.
[1] Details behind the calculations in Figure 1 are in Appendix A.
[2] Our peer group for GE consists of several other industrial conglomerates: 3M (MMM), Honeywell (HON), Siemens (SIEGY), Textron (TXT), Illinois Tool Works (ITW), United Technologies (UTX), and Emerson Electric (EMR).
[3] See Figures I and II in Appendix A for details behind the calculations of the implied stock prices and implied ROIC.
[4] Profitable means that the ROIC > WACC for any growth initiatives.
[5] Please see Figure III in Appendix A for details behind the calculations of the implied stock prices and ROIC.
[6] Technically this driver is ROIC-WACC. We focus on ROIC given that most of WACC is the cost of equity, which is largely outside of management’s control. ROIC reflects the operations of the business, where management can affect the most change.
[7] See Scenario 4 in Figure III in Appendix A for an example of how revenue growth without a change in ROIC creates no incremental value. The spreadsheet that provides all the implied values is available at this link.
[8] Full details for these scenarios can be seen in Figure III in Appendix A.
[9] Note that NOPAT is the same as Free Cash Flow when we assume there is no growth in the business.
[10] More details on non-operating assets are in our Economic Book Value definition.
[11] PVGO, in this instance, refers to all stakeholders. The market value, i.e. equity stakeholder portion, of the PVGO is $102 billion.
Click here to download a PDF of this report.
Photo Credit: Chuck Miller (Flickr)