
For the best financial analysis ratios, look no further. Harvard Business School and MIT Sloan empirically demonstrate the superiority of the data that drives our models and calculations. This paper compares our financial analysis to Bloomberg and Capital IQ (see appendix for details).
In our recent article on the flaws in return on equity, we showed how it has no correlation with several different measures of valuation. However, there is one valuation metric, price-to-book (“P/B”), that, at first, appears to correlate strongly with ROE. A more rigorous look reveals the relationship between the two variables is not as strong as it first appears. Major outliers can disproportionately skew correlations, and that’s what happens with a cursory assessment of the ROE versus P/B correlations. Removing those companies (just 3 in this case) that each had at least a 5% impact on the r-squared value, along with the companies that had negative book values, reveals a weak, 27%, correlation. See Figure 1.
Figure 1: Correlation Is Not Actually That Significant
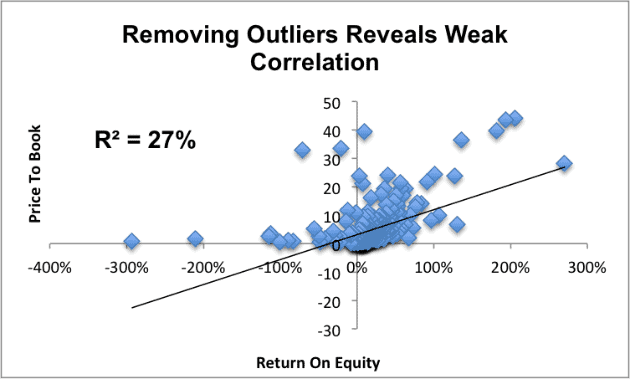
Sources: New Constructs, LLC and company filings.
When not removing any of the major outliers that skew the correlations, ROE and P/B can have an extremely high correlation. Figure 2 shows an r-squared value of 85%.
Figure 2: Seemingly High Correlation Between ROE and P/B
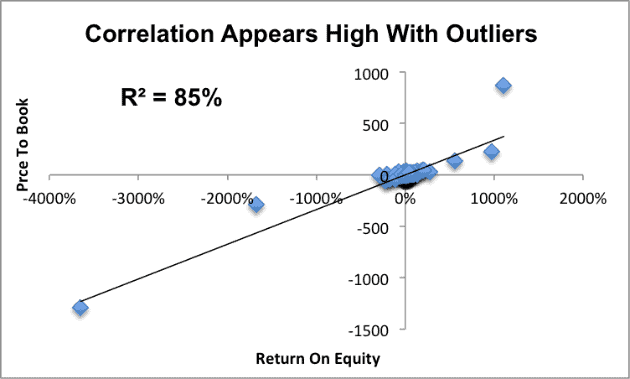
Sources: New Constructs, LLC and company filings.
As Figure 1 shows, changes in ROE actually explain just 27% of the difference in P/B between different companies. Neither metric is a consistently useful valuation indicator. Both are prone to significant deviation from underlying economic reality because they both rely on the same flawed accounting rules.
Book Value Can Be Misleading
Accounting book value suffers from a few major flaws when it comes to measuring valuation
- That book value can be written down at management’s discretion at any time.
- Businesses can hide both assets and liabilities off the balance sheet so that they are not reflected in accounting book value.
- Accounting rules are designed to give the best estimate of liquidation value for debt investors, not to measure the capital used to generate returns, which is what matters to equity investors.
Since shareholder’s equity and accounting book value are the same thing, both ROE and P/B rely on this same accounting construct, making them both equally unhelpful for equity investors.
The Threat Of Write-Downs
Mergers and acquisitions represent some of the most common sources of artificial book value. We warned investors about this fact back in July with our article on goodwill. When one company buys another company at a premium to its net asset value, the excess purchase price is recorded as goodwill. Goodwill is recorded as part of accounting book value, but often ends up getting written down if the acquisition underperforms expectations.
Write-downs end up being very common. 53% of all acquisitions end up destroying value, and we’ve found tens of thousands of write-downs totaling over a trillion dollars in value in the filings we’ve parsed dating back to 1998.
Figure 3: Book Value Disappears During Times Of Risk
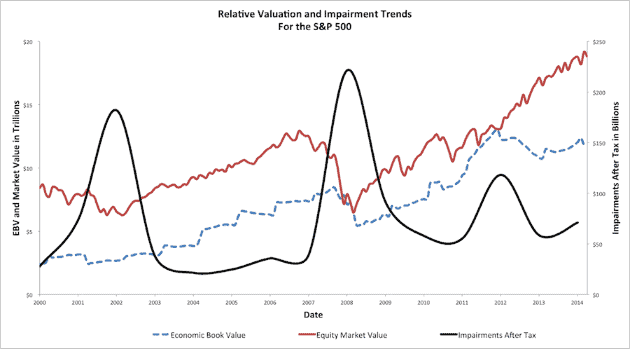
Sources: New Constructs, LLC and company filings.
They end up happening most often during market crashes, as shown in Figure 2. That means investors who though they were in cheap stocks due to the P/B ratio come in for a nasty surprise when billions of dollars get wiped off the balance sheet.
Hidden Assets And Liabilities
We make several adjustments to get from reported net assets to invested capital because companies can hide assets and liabilities off of the balance sheet in the form of reserves, operating leases, deferred compensation, and many other techniques.
These off-balance sheet arrangements meant that the shareholder’s equity line ignores a significant amount of the resources that a company uses in its operations.
Liquidation Value Has Limited Value For Equity Investors
Accounting book value is meant to measure the potential assets available to investors in the event of liquidation, and that’s simply not a very useful measurement for most equity investors. If the company you’re investing in gets liquidated, that’s almost always a failed investment.
Even the idea that a low price to book limits your potential downside is flawed. Write-downs or hidden liabilities can send the stock price below book value, as can a company earning a negative return on invested capital (ROIC).
Accounting rules were designed to be used by debt investors. Equity investors should not expect the financial statements generated by these rules to contain the numbers that accurately reflect their concerns.
Measure Economic Book Value
Instead of focusing on accounting book value, investors should be looking for companies that have a low price to economic book value (PEBV). Rather than relying on accounting rules, economic book value comes from after tax operating profit (NOPAT) and weighted average cost of capital (WACC). Instead of measuring the liquidation value of a company, it measures its zero-growth value, which is a better baseline for equity investors.
Rather than looking at the flawed metrics of ROE and P/B, we’ve found that ROIC and PEBV tend to be better indicators of future performance. Recent examples of this phenomenon include:
- Nvidia (NVDA), our long idea on September 24. From an ROE and P/B perspective, NVDA looked like it was middle of the pack in the semiconductor industry. Our research showed that it was actually one of the most profitable and cheapest companies in the industry, with an ROIC above 30% and a PEBV of just 1.1, implying only 10% NOPAT growth for the rest of its corporate life. In the past two and a half months, NVDA is up 37%
- El Pollo Loco (LOCO), our Danger Zone pick from March. Non-operating items inflated GAAP net income, and off-balance sheet debt obscured the true amount of capital used in the company’s operations. This helped LOCO earn an ROE of 20%, much higher than its actual ROIC of just 6%. And while its P/B of 4.8 didn’t look cheap, it was still better than its PEBV of 5.2. LOCO has collapsed in recent months and is now down over 50% since our call.
Looking at ROIC and PEBV help you to identify winners and losers because those metrics cut through the noise and artificial accounting constructs that are at the heart of the valuation methodologies used by many investors.
Disclosure: David Trainer and Sam McBride receive no compensation to write about any specific stock, sector, style, or theme.
Click here to download a PDF of this report
Photo Credit: Gotcredit.com (Flickr)