This week, we’ve found a company that should not only beat short-term earnings expectations (based on our Earnings Distortion Score), but has improving fundamentals, multiple growth opportunities, and an undervalued stock price. W.R. Grace & Company (GRA: $69/share) is this week’s Long Idea.
Earnings Distortion Score: Beat
GRA earns our “Beat” Earnings Distortion Score because our adjusted measure of core earnings shows GRA’s earnings are understated based on unusual expenses missed in IBES’s Street Earnings and Compustat’s Income Before Special Items (as featured in this Harvard Business School and MIT Sloan paper). Our Earnings Distortion Scores indicates how likely a company is to beat or miss estimates.
Over the trailing twelve months (TTM), GRA has -$59 million in net earnings distortion[1], which means reported earnings are understated. Notable unusual expenses buried in the fine print of GRA’s filings include:
- $66 million (3% of revenue) in after-tax charges due to legacy product, environmental, and other claims.
- $36 million (2% of revenue) after-tax restructuring charges.
In total, we identified $0.88/share (26% of reported EPS) in net unusual expenses in GRA’s TTM GAAP results. After removing this earnings distortion from GAAP net income, we see that GRA’s TTM core earnings of $4.23/share are significantly above GAAP EPS of $3.35/share.
With understated earnings, and a “Beat” Earnings Distortion Score, GRA is likely to beat the $4.33/share IBES consensus estimate for fiscal 2019.
Unusual Charges Should Subside in Near-Term
The legacy product claims noted above stem from the company’s now-defunct attic insulation products that were found to contain asbestos in the 1990’s. Legal liabilities – for personal health, property damage, and environmental cleanup from its mine – drove the company into bankruptcy in 2001. After 13 years in bankruptcy, GRA emerged in 2014.
While GRA has faced ongoing costs from this issue, 2018 expenses were unusually high. In 2016-2017, it recorded an average after-tax charge of $21 million (compared to $66 million in 2018). More importantly, GRA’s final expenses for these liability issues should be settled after the EPA issues its record of decision in 2021.
In addition, GRA’s TTM earnings have been hit by a bankruptcy at a large customer, which was driven by a refinery explosion. However, the company expects to earn an insurance recovery that will replace the lost earnings from that customer in Q4. The insurance will also cover business interruption expenses into 2020, which gives GRA the time to identify new customers to replace the volume without sacrificing margins.
GRA’s Profitability Is Tops Among Industry Giants
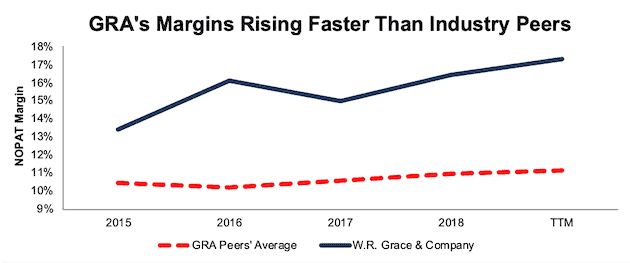
Despite a host of competitors, GRA has achieved its global scale in FCC catalysts (an almost oligopolistic market) and growing presence in polyolefin catalysts while earning higher margins, that are rising faster, than peers. Per Figure 1, GRA’s NOPAT margin has improved from 13% in 2015 to 17% TTM. Meanwhile, the cap-weighted average of the 21 Specialty Chemicals firms under coverage improved from just 10% to 11% over the same time.
Figure 1: GRA’s NOPAT Margin Vs. Industry Peers

Sources: New Constructs, LLC and company filings.
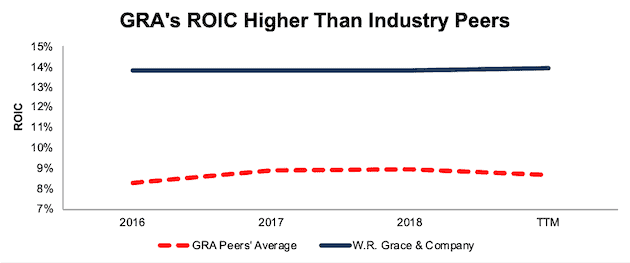
The firm’s NOPAT margin improved enough to offset the recent decline in invested capital turns to keep GRA’s ROIC well above peers. Per Figure 2, GRA currently earns a 14% ROIC, as it has in each of the past three years. Meanwhile, the cap-weighted peer average is much lower, at 9%.
Figure 2: GRA’s ROIC vs. Industry Peers

Sources: New Constructs, LLC and company filings.
Shifting Business Minimizes Risk of Oil Decline
GRA’s largest business is its FCC catalysts, which are used to refine crude oil into transportation fuels such as gasoline and diesel. This segment made up 42% of sales in 2018. It is largely an oligopoly, as the top four firms in the industry accounted for more than 80% of the market share in 2018.
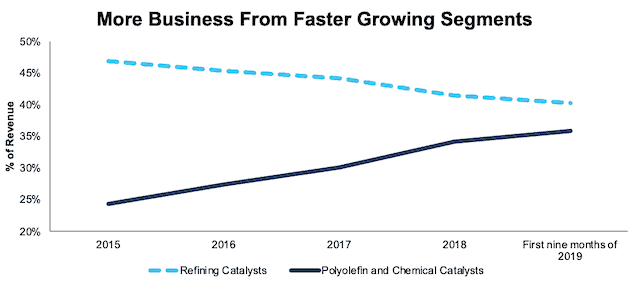
Bears will argue that this segment, which is already more sensitive to changes in oil prices, faces a long-term threat from the rise of renewable energy. And, they’re right. Fortunately, GRA has been diversifying away from its reliance on refining and into other segments. Figure 3 shows Refining Catalysts has fallen from 47% of revenue in 2015 to just 40% through the first nine months of 2019.
Figure 3: GRA Refining Vs. Polyolefin and Chemical Catalysts as Percent of Revenue

Sources: New Constructs, LLC and company filings.
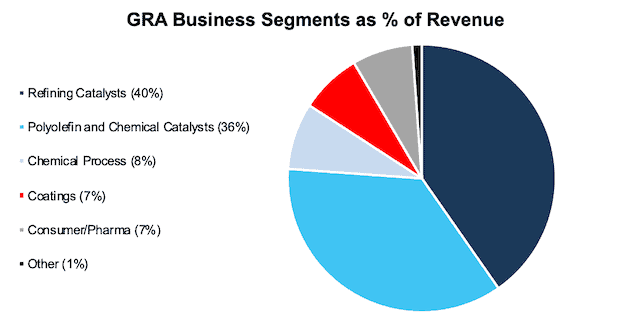
Meanwhile, GRA has grown its Polyolefin and Chemical catalysts segment from 24% to 36% of revenue over the same time. This growth was aided by the 2018 acquisition of Albemarle’s polyolefin business for $418 million. Figure 4 shows the current breakdown of GRA’s business lines through the first nine months of 2019.
Figure 4: W.R. Grace & Company Sales Breakdown – Through First Nine Months of 2019

Sources: New Constructs, LLC and company filings
New Businesses Offer Faster Growth Prospects
Apart from minimizing its reliance on refining catalysts, investing in and expanding its polyolefin business moves GRA’s operations into a faster growing market. Transparency Market Research, an industry research provider expects the FCC catalyst industry to grow by 3.5% compounded annually from 2019-2027.
Meanwhile, Markets and Markets, another industry research provider, expects the Polypropylene catalyst industry to grow by 5.9% compounded annually from 2019-2027.
Licensing Business Creates New Long-Term Sales Opportunities
As part of its increased focus on polyolefins, GRA has expanded from producing chemicals to licensing its polypropylene production technology to customers. The firm licenses its gas-phase polypropylene process technology, UNIPOL, to polypropylene manufacturers. This technology is designed to have fewer moving parts, require less equipment than competing technologies, and reduce operating costs.
Rather than producing the chemicals itself, GRA enters into contracts to design manufacturing facilities, train personnel, and provide ongoing support for the customer to produce the chemicals. These licenses provide incremental revenue in the short-term, but, as management stated in its 3Q19 earnings call, “in the long-term, the value of the catalyst is actually the bigger piece.” As these licensed units come online, GRA views them as pipelines for future catalyst sales to further aid in polypropylene manufacturing.
Management notes the licensing business provides a benefit for three to four years upfront, and the subsequent catalyst sales provide a revenue and earnings stream for “many years to come.” In other words, UNIPOL licenses not only provide additional revenue, but also future sales opportunities that help to further diversify away from its oil refining business.
Cheap Valuation Provides Upside
Despite the improving fundamentals and shift to higher value businesses, GRA is down 4% over the past year (S&P 500 +23%) and down 5% over the past two years (S&P 500 +18%).
At its current price of $69/share, GRA has a price to economic book value (PEBV) ratio of 1.1. This ratio means the market expects GRA’s NOPAT to grow by no more than 10% over the remaining life of the firm. This expectation seems pessimistic for a firm that has grown NOPAT by 11% compounded annually since 2016 and is in businesses that are expected to grow 5% on average through 2027.
W.R. Grace & Company’s cheap valuation means that the stock still has significant upside potential.
Below, we use our reverse DCF model to see what the stock could be worth given conservative assumptions about future growth in cash flows.
If GRA can maintain 2018 NOPAT margins of 16% (below TTM margins of 17%) and grow NOPAT by just 4% compounded annually (low-end of management’s forecasted growth range) for the next decade, the stock is worth $88/share today, a 28% upside to the current stock price. See the math behind this reverse DCF scenario.
Sustainable Competitive Advantages Will Drive Shareholder Value Creation
Here’s a summary of why we think the moat around GRA’s business will enable it to continue to generate higher NOPAT than the current market valuation implies. The following competitive advantages help GRA offer better products at lower prices and prevent competition from taking market share:
- As the leader in the majority of its end markets, GRA enjoys superior economies of scale
- Higher margins than peers provide flexibility to compete on price while remaining profitable
- UNIPOL licensing further integrates GRA into end user’s process and creates future sales opportunities
What Noise Traders Miss with GRA
These days, fewer investors focus on finding quality capital allocators with shareholder friendly corporate governance. Instead, due to the proliferation of noise traders, the focus is on technical trading trends while high-quality fundamental research is overlooked. Here’s a quick summary of what noise traders are missing:
- Earnings Distortion causes understated reported earnings
- ROIC is well above its peer group
- Shift to faster growing business segments creates growth opportunities
- Valuation implies minimal future growth in profits
Earnings Beat Could Drive Shares Higher
As noted above, GRA earns our “Beat” Earnings Distortion Score, which means we expect it to beat earnings expectations due to unusual earnings distortion that cause earnings to be understated. Understated earnings also play a role in falling analyst estimates. In August 2019, consensus estimates for 2020 earnings were $5.11/share. Now, consensus estimates have fallen to $4.82/share. Lowered expectations make it easier for GRA to beat going forward, given its improving fundamentals.
Based on the findings of “Core Earnings: New Data and Evidence,” we know that analysts are “slow to impound the implications of certain transitory gains and losses in their earnings forecasts.” Our research gives investors the ability to identify these transitory items, and, along with our Earnings Distortion Scores, identify companies that are (1) more profitable than the market realizes and (2) likely to beat earnings.
Regardless of falling estimates, our data shows that GAAP EPS is understated. Eventually, the GAAP earnings will catch up, and shares should rise as well.
Dividends and Buybacks Offer Over 3% Yield
GRA began paying dividends again in 2016, at an annual rate of $0.68/share. GRA has increased its dividend in each year since, and its current quarterly dividend of $0.27/share equates to $1.08/share on an annualized basis. The current annualized dividend gives the company a dividend yield of 1.5%.
In addition to dividends, GRA returns capital to shareholders through share repurchases. In 2018, GRA repurchased $80 million worth of shares. Over the TTM period, GRA has repurchased $50 million (1% of market cap) worth of shares. GRA is authorized to purchase up to $109 million more worth of shares.
If GRA repurchases shares in line with 2018, we would expect it to repurchase up to 1.7% of the current market cap, which, when combined with the 1.5% dividend yield, give GRA a total shareholder yield of over 3%.
Executive Compensation Could be Improved
GRA executives receive annual bonuses based on adjusted EBIT, adjusted free cash flow, and adjusted net sales goals. In addition, executives receive performance based equity awards that are tied to growth in adjusted EPS and total shareholder return. Unfortunately, none of these metrics are tied to creating shareholder value.
While GRA doesn’t tie executive compensation to ROIC, one of the goals of its “Grace Value Model” is to “maintain our high return on invested capital.” The company also regularly features ROIC in its investor presentations.
However, GRA should go one step further and tie performance compensation to improvement in ROIC, as there is a strong correlation between improving ROIC and increasing shareholder value. Tying executive compensation to ROIC also ensures that executives’ interests are properly aligned with shareholders’ interests.
Despite using different metrics, GRA’s plan has not compensated executives while destroying shareholder value. GRA has grown economic earnings from $156 million in 2016 to $205 million TTM.
Insider Trading and Short Interest Are Minimal
Over the past twelve months, insiders bought 606 thousand shares and sold 176 thousand for a net effect of 430 thousand shares purchased. These purchases represent 1% of shares outstanding.
There are currently 804 thousand shares sold short, which equates to 1% of shares outstanding and 2 days to cover. Short interest is up 23% from the prior month, despite no change in the firm’s fundamentals.
Critical Details Found in Financial Filings by Our Robo-Analyst Technology
As investors focus more on fundamental research, research automation technology is needed to analyze all the critical financial details in financial filings as shown in the Harvard Business School and MIT Sloan paper, "Core Earnings: New Data and Evidence”.
Below are specifics on the adjustments we make based on Robo-Analyst findings in W.R. Grace & Company’s 2018 10-K:
Income Statement: we made $324 million of adjustments with a net effect of removing $149 million in non-operating expenses (8% of revenue). See all adjustments made to GRA’s income statement here.
Balance Sheet: we made $1.1 billion of adjustments to calculate invested capital with a net decrease of $750 million. One of the most notable adjustments was $162 million (5% of reported net assets) in excess cash. See all adjustments to GRA’s balance sheet here.
Valuation: we made $2.6 billion of adjustments with a net effect of decreasing shareholder value by $2.3 billion. Apart from $2 billion in total debt, the most notable adjustment to shareholder value was $442 million in underfunded pensions. This adjustment represents 9% of GRA’s market cap. See all adjustments to GRA’s valuation here.
Attractive Funds That Hold GRA
The following funds receive our Attractive-or-better rating and allocate significantly to W.R. Grace & Company.
- ICON Natural Resources Fund (ICBMX) – 3.6% allocation and Attractive rating.
- Janus Henderson Small-Mid Cap Value Fund (JVSIX) – 2.1% allocation and Attractive rating.
This article originally published on January 29, 2020.
Disclosure: David Trainer, Kyle Guske II, and Matt Shuler receive no compensation to write about any specific stock, style, or theme.
Follow us on Twitter, Facebook, LinkedIn, and StockTwits for real-time alerts on all our research.
[1] In Core Earnings: New Data & Evidence, professors at Harvard Business School (HBS) & MIT Sloan empirically show that our “novel dataset” is superior to “Street Earnings” from Refinitiv’s IBES, owned by Blackstone (BX) and Thomson Reuters (TRI), and “Income Before Special Items” from Compustat, owned by S&P Global (SPGI).
