
Many companies rely on misleading “adjusted” metrics to trick investors into thinking their business is stronger than it is in reality. The law allows companies to invent entirely new metrics or manipulate others to support a narrative that paints a more positive picture of the firm’s fundamentals.
These companies often include disclaimers that caution against using non-GAAP metrics. Yet, the Street often builds its narratives on these “adjusted” metrics.
“Adjusted” metrics are not the only problem. GAAP earnings are often misleading. Unusual, one-time gains or losses frequently distort reported GAAP results and cloud investors’ ability to understand the true economic performance of companies.
To uncover real, core earnings, investors must dig into the details buried in the footnotes.
This week’s Danger Zone pick is a perfect example of just how misleading reported earnings can be. The company recently reported positive GAAP earnings for the first time since its IPO. Meanwhile, Core Earnings remain highly negative. Further analysis reveals the company is burning through cash at an alarming pace. Only by leveraging our superior fundamental data can investors get the truth about this company’s profitability, or lack thereof.
We first put Affirm Holdings (AFRM: $76/share) in the Danger Zone in October 2021, reiterated our bearish opinion most recently in October 2024, and named it a Zombie Stock in September 2022. See all our reports on Affirm here. Since our original report, AFRM has outperformed the S&P 500 as a short, falling 32% while the S&P 500 is up 53%.
However, the stock is up 25% year-to-date (YTD) and recently reported positive GAAP net income. GAAP profits may have investors re-thinking this company, so we believe now is a great time to remind investors how GAAP net income is misleading and show how AFRM remains overvalued.
Affirm’s stock could fall further based on:
- negative Core Earnings and persistent cash burn,
- lack of scale and competitive advantages in a competitive market,
- profitability that ranks below nearly all competitors,
- a stock valuation that implies the company will grow gross merchandise volume (GMV) to nearly two-thirds of Amazon’s fiscal 2024 GMV.
Figure 1: Affirm’s Outperformance as a Short From 10/4/21 Through 9/26/25
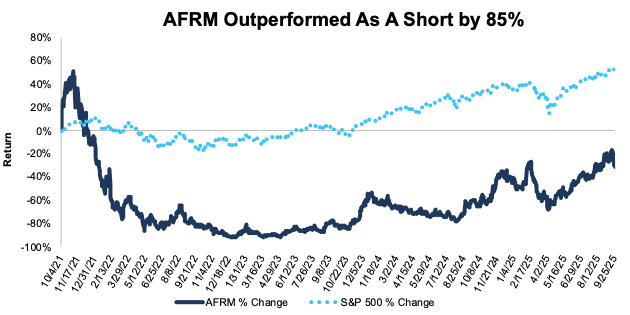
Sources: New Constructs, LLC
What’s Working
Positive Top-Line and GAAP Profits
Affirm continues to grow its top-line at impressive levels. In fiscal 4Q25, revenue and gross merchandise volume (GMV) grew 33% and 43% year-over-year (YoY), respectively. For the full year of fiscal 2025, Affirm grew revenue and GMV 39% and 38% YoY, respectively.
The company also successfully onboarded new customers and merchants, with active consumers and active merchants rising 23% and 24% YoY respectively in fiscal 2025.
Perhaps most noteworthy – at least to investors that don’t look beyond the surface numbers – Affirm generated positive GAAP net income in fiscal 2025, a first since fiscal 2019.
What’s Not Working
While Affirm reports positive top-line growth and GAAP net income, a deeper analysis, one that accounts for the footnotes and MD&A of company filings, reveals a different picture.
Beyond profitability, the company’s stock price remains overvalued, and after rising 83% last year and 25% YTD, it carries large downside risk. More on that later.
Affirm Remains Unprofitable in Reality
Affirm has not reported positive operating profit in any fiscal year of our company model, which dates back to fiscal 2019. The company has not generated positive Core Earnings since fiscal 2019 either.
This fact begs the question, how does Affirm report positive GAAP net income if reported operating profit and our calculated Core Earnings are negative?
The answer is non-operating income or income unrelated to its core business.
In fiscal 2025, Affirm reported an operating loss of -$87 million. However, the company reported $149 million in “Other Income, net” on its income statement. This other income is interest earned on money market funds included in cash and cash equivalents and restricted cash and interest earned on securities available for sale, among other items. In other words, Affirm has a lot of cash and securities from all the stock it has sold, and that’s where it gets the income to generate positive GAAP net income, not from its core operation.
We leverage our Robo-Analyst AI Agent to calculate Core Earnings, a proven superior earnings measure that excludes these unusual gains/losses. In doing so, we find that Affirm’s Core Earnings remain negative at -$78 million in Fiscal 2025. Figure 2 provides a reconciliation from GAAP Net Income to Core Earnings.
Figure 2: Affirm’s GAAP Net Income to Core Earnings Reconciliation: Fiscal 2025

Sources: New Constructs, LLC and company filings
Costs Are Still Higher Than Revenues
In Affirm’s quest to take market share, it has adopted a growth-at-all-costs approach, even going so far as stating “growth is always the answer” in the company’s fiscal 4Q24 shareholder letter.
Total operating expenses, which include loss on loan purchase commitment, provision for credit losses, funding costs, processing and servicing, technology and data analytics, sales and marketing, general and administrative, and restructuring and other were 103% of revenue in fiscal 2025, which further explains why, as noted above, reported operating income is negative.
No Longer a Zombie Stock, But Still in the Danger Zone
When we first named Affirm a Zombie Stock in September 2022 it had enough cash on hand to sustain its cash burn for another 10 months.
Affirm slowed its FCF burn from -$814 million in fiscal 2024 to -$425 million in fiscal 2025. The lower, yet still negative, FCF means Affirm no longer qualifies as a Zombie Stock because it has enough cash on hand to sustain its fiscal 2025 FCF burn for 61 months from the end of September 2025.
Despite positive GAAP net income, Affirm continues to burn through cash each year. Affirm’s free cash flow (FCF) has been negative on an annual basis in every year since fiscal 2019. On a quarterly basis, FCF has been negative in 14 of the 15 quarters over the same time.
In fiscal 2025, the company burned -$425 million in FCF excluding acquisitions. From fiscal 2020 through fiscal 2025, Affirm burned through a cumulative $5.1 billion (18% of enterprise value) in FCF excluding acquisitions. See Figure 3.
Figure 3: Affirm’s Cumulative Free Cash Flow: Fiscal 2020 – Fiscal 2025
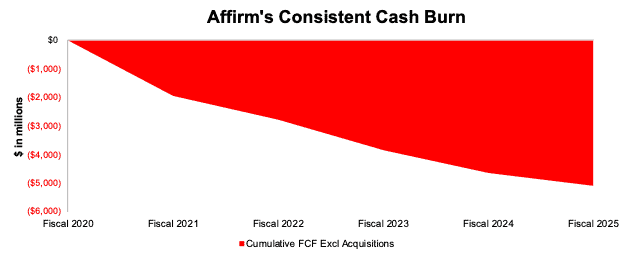
Sources: New Constructs, LLC and company filings
Shareholders Get More Diluted
Per Figure 4, Affirm’s shares outstanding increased from 47 million in fiscal 2019 to 323 million in fiscal 2025.
Whether through new share issuances or stock-based compensation, funding the business with new investors capital is not sustainable and not that different from a ponzi scheme.
Figure 4: Affirm’s Shares Outstanding: Fiscal 2019 Through Fiscal 2025
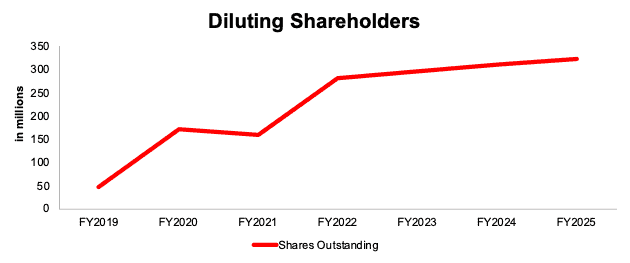
Sources: New Constructs, LLC and company filings
$1.7 Trillion Elephant in the Room
In our recent report on Klarna (KLAR), one of Affirm’s key competitors, we pointed out how a growth-at-all-costs strategy can be successful in attracting users and growing GMV. In fact, Klarna used this approach to grow both users and GMV than traditional buy-now pay later peers Affirm and Afterpay (owned by Block, ticker XYZ).
However, compared to PayPal (PYPL), the pure-play BNPL companies are miniscule. PayPal generated $1.7 trillion in total payment volume (TPV) in the TTM, with upwards of 434 million users/accounts. The scale and ubiquity of PayPal create strong competitive advantages, which ultimately manifest in higher margins and profitable operations.
Figure 5: Comparing Users and GMV: BNPL Competitors: TTM

Sources: New Constructs, LLC and company filings
* User data from end of 2023, when Afterpay last disclosed users
**Annualized based on latest disclosed GMV of $8.24 billion in 3Q24
BNPL Firms Struggle to Generate Profits
Payment plans or installment loans may look more attractive in an economic slowdown and as affordability of everyday items decreases. But such a slowdown doesn’t make one BNPL firm more attractive than another. Ultimately, each company is offering a largely undifferentiated product.
Of buy now pay later (BNPL) users, PayPal (PYPL) is the clear top choice, with 56% of BNPL users having used PayPal, compared to 38% for Affirm.
Additionally, merchants and retailers benefit from BNPL providers like Affirm and Klarna, which assume the credit risk of payment in return for a small fee paid by the merchant. Sure, Affirm gains users and GMV, but this structure leaves BNPL firms exposed to all the risk of payment. A recent study from LendingTree found that 41% of BNPL users say they paid late in the past year, which is up from 34% a year ago.
Given these dynamics, it shouldn’t be surprising that the two pure-play BNPL companies are only competitors that don’t generate an ROIC and NOPAT margin above 0%. See Figure 6. Each of the other competitors, including PayPal (PYPL), JPMorgan Chase (JPM), American Express (AXP), Synchrony Financial (SYF), and others have more profitable business lines that can offset offering 0% interest loans and payment plans.
Figure 6: Affirm Profitability Vs. Competitors: TTM
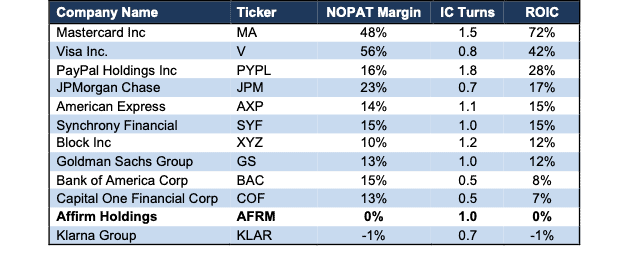
Sources: New Constructs, LLC and company filings
Current Price Implies Affirm’s GMV Reaches Over Half the GMV of Amazon
Below, we use our reverse discounted cash flow (DCF) model to analyze the future cash flow expectations baked into Affirm’s stock price. We also present an additional DCF scenario to highlight the downside risk in the stock if Affirm fails to achieve the overly optimistic expectations in the current stock price.
To justify its current price of $76/share, our model shows that Affirm would have to:
- immediately improve NOPAT margin to 15.5% (equal to PayPal’s TTM NOPAT margin vs. Affirm’s 0% NOPAT margin in fiscal 2025) and
- grow revenue 30% (compared to consensus estimates of 23% in fiscal 2026, 24% in fiscal 2027, and 1.4x the projected industry growth rate through 2032) compounded annually through fiscal 2035.
In this scenario, Affirm’s revenue would reach $42.8 billion in fiscal 2035, or 13.3 times higher than the company’s fiscal 2025 revenue and 110% of Visa’s TTM revenue. In this scenario, Affirm’s NOPAT would reach $6.6 billion in fiscal 2035, or 1.3x PayPal’s TTM NOPAT and 2.8x Block’s TTM NOPAT. Contact us for the math behind this reverse DCF scenario.
If we assume Affirm maintains a revenue to GMV rate of just under 9% (equal to fiscal 2025), then this scenario implies Affirm’s GMV in fiscal 2035 equals $487 billion compared to fiscal 2025 GMV of $37 billion.
For context, Amazon’s (AMZN) 2024 (calendar year) U.S. GMV is estimated at $792 billion. In other words, Affirm would need to generate nearly two-thirds the GMV of Amazon to justify its current stock price.
Also keep in mind, companies that grow revenue by 20%+ compounded annually for such a long period are also “unbelievably rare”, making the expectations in Affirm’s valuation even more unrealistic.
There’s 40%+ Downside at Consensus Growth Rates
If we instead assume:
- NOPAT margin immediately improves to 15.5%,
- revenue grows by consensus estimates in fiscal 2026 (23%) and fiscal 2027 (24%), and
- revenue grows by 21% (projected industry growth) compounded annually through fiscal 2035, then
the stock would be worth just $45/share today – a 41% downside to the current price.
In this scenario, Affirm’s revenue would reach $23.0 billion in fiscal 2035, or 7.1 times higher than the company’s fiscal 2025 revenue and 97% of Block’s TTM revenue. In this scenario, Affirm’s NOPAT would reach $3.6 billion in fiscal 2035, or nearly equal to Synchrony’s TTM NOPAT. Contact us for the math behind this reverse DCF scenario.
If we again assume Affirm maintains a revenue to GMV rate of just under 9%, then this scenario implies Affirm’s GMV in fiscal 2035 equals just under $262 billion, up from $37 billion in fiscal 2025.
There’s 60%+ Downside if Margins Are Capped by Competition
Lastly, if we assume:
- NOPAT margin immediately improves to 10% (Block’s TTM margin) through fiscal 2035,
- revenue grows by consensus estimates in fiscal 2026 (23%) and fiscal 2027 (24%), and
- revenue grows by 21% (projected industry growth) compounded annually through fiscal 2035, then
the stock would be worth just $28/share today – a 63% downside to the current price. This scenario still implies that Affirm generates $2.3 billion in NOPAT in fiscal 2035. Contact us for the math behind this reverse DCF scenario.
Figure 7 compares Affirm’s implied future NOPAT in these scenarios to its historical NOPAT. For reference, we include PayPal and Block’s TTM NOPAT.
Figure 7: Affirm’s Historical and Implied NOPAT: DCF Valuation Scenarios
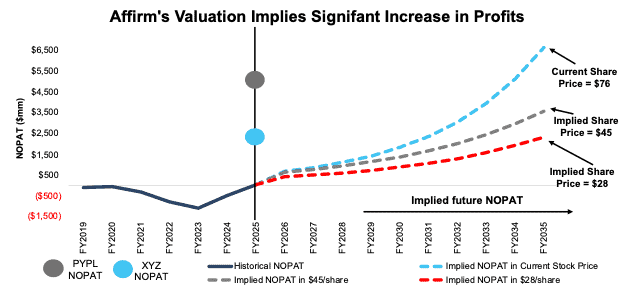
Sources: New Constructs, LLC and company filings
Stock is Still Not Worth $1
Each of the above scenarios assume Affirm grows revenue, NOPAT, and FCF without increasing working capital or fixed assets. This assumption is highly unlikely but allows us to create best-case scenarios that demonstrate the high level of expectations embedded in the current valuation. For reference, Affirm’s invested capital has grown 32% compounded annually since fiscal 2019. If we assume Affirm’s invested capital increases at a similar rate in the DCF scenarios above, the downside risk is even larger.
Given that the performance required to justify its current price is overly optimistic, we dig deeper to see if Affirm is worth buying at any price. The answer is no.
The company owes $32 million in total debt, has $728 million in outstanding employee stock option liabilities, $695 in minority interests, and has no excess cash. Affirm has an economic book value, or no growth value, of -$2/share. In other words we do not think equity investors will ever see $1 of economic earnings under normal operations, which means the stock would be worth $0 today.
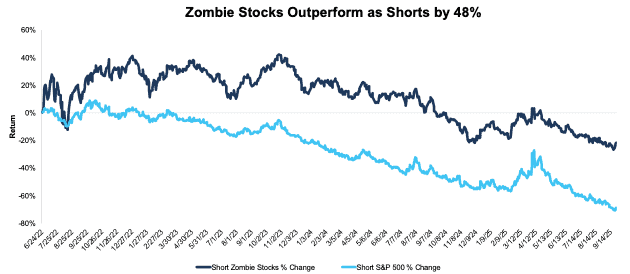
The Zombie Stock List Beats the S&P 500 by 48%
We started our Zombie Stock List in June 2022 and have added a total of 33 stocks to the list. After this report, and removing Affirm, 12 stocks remain on the list. The short strategy based on our Zombie Stock List has outperformed the S&P 500 by 48% since inception in June 2022. See Figure 8.
Companies are removed from the list when:
- their stock prices have fallen close to $0,
- they have extended their cash runway by raising capital,
- they have been acquired and saved from going to $0, or
- they have turned their businesses around and look like they will avoid bankruptcy.
Prior reports where we removed stocks from the Zombie Stock List are here, here, here, here, here, here, here, here, here, here, and here.
When we select companies to add to the Zombie Stock list, we look for companies that have:
- less than 24 months of cash to sustain their high cash burn, and
- a negative interest coverage ratio (EBIT/Interest expense).
The Full Zombie Stock List Below
Figure 8 shows all 33 Zombie Stocks. We mark those that have been removed from the list with an asterisk.
Figure 8: Zombie Stock Reports: With Performance Since Publish Date Through 9/26/25
| Company Name | Ticker | Date Added | Return Since Add Date | Return as Short Vs. S&P 500 |
| Freshpet Inc.* | FRPT | 6/23/22 | -16% | 9% |
| Peloton Interactive | PTON | 6/23/22 | -22% | 92% |
| Carvana Co. | CVNA | 6/23/22 | 1072% | -1002% |
| Snap Inc.* | SNAP | 7/22/22 | 9% | 36% |
| Beyond Meat, Inc. | BYND | 8/1/22 | -91% | 154% |
| Rivian Automotive* | RIVN | 8/8/22 | -61% | 94% |
| DoorDash, Inc. | DASH | 8/10/22 | 237% | -179% |
| Shake Shack, Inc.* | SHAK | 8/10/22 | 112% | -75% |
| AMC Entertainment | AMC | 8/15/22 | -99% | 153% |
| GameStop Corporation* | GME | 8/15/22 | -68% | 69% |
| Chewy Inc.* | CHWY | 8/17/22 | -55% | 57% |
| Uber Technologies* | UBER | 8/17/22 | 146% | -112% |
| Robinhood Markets* | HOOD | 8/22/22 | 307% | -261% |
| Tilray Brands* | TLRY | 9/7/22 | -49% | 92% |
| Affirm | AFRM | 9/19/22 | 243% | -171% |
| Sunrun | RUN | 9/22/22 | -43% | 123% |
| Blue Apron * | APRN | 9/26/22 | -79% | 95% |
| RingCentral | RNG | 10/3/22 | -28% | 103% |
| Allbirds Inc.* | BIRD | 10/17/22 | -71% | 89% |
| Wayfair | W | 11/14/22 | 106% | -39% |
| Atlassian* | TEAM | 11/16/22 | 43% | -32% |
| Bill.com | BILL | 11/16/22 | -54% | 122% |
| Okta* | OKTA | 11/16/22 | 47% | -2% |
| Oatly* | OTLY | 11/21/22 | -62% | 71% |
| Twilio* | TWLO | 11/23/22 | 39% | 4% |
| Ceridian* | CDAY | 11/23/22 | -3% | 11% |
| Redfin* | RDFN | 11/30/22 | 100% | -61% |
| Five9 Inc.* | FIVN | 12/5/22 | -37% | 72% |
| Opendoor* | OPEN | 1/30/23 | -9% | 50% |
| Compass Inc. | COMP | 2/6/23 | 88% | -28% |
| Sweetgreen Inc. | SG | 3/13/23 | 17% | 53% |
| Lucid Group* | LCID | 4/10/23 | -23% | 31% |
| Trupanion* | TRUP | 5/1/23 | 4% | 34% |
| Five9 Inc. | FIVN | 8/20/25 | -2% | 6% |
| Overall Portfolio Return | 22% | 48% | ||
Sources: New Constructs, LLC and company filings.
*Stocks removed from the Zombie Stock List. Performance tracked through the date each was removed. Linked report goes to the report in which the stock was removed.
Since our first report on June 23, 2022, the Zombie Stocks as shorts are down 22% while shorting the S&P 500 is down 70%. See Figure 9.
Figure 9: Combined Performance of Zombie Stocks List Through 9/26/25
Sources: New Constructs, LLC and company filings.
This article was originally published on September 29, 2025.
Disclosure: David Trainer, Kyle Guske II, and Hakan Salt receive no compensation to write about any specific stock, sector, style, or theme.
Questions on this report or others? Join our online community and connect with us directly.