Return on invested capital (ROIC) is the primary driver of shareholder value creation. The financial media may focus its attention on earnings per share and a variety of non-GAAP metrics that companies selectively provide, but sophisticated investors know the truth.
Don’t just take our word for it. Many third-party research papers have reinforced this link:
- McKinsey & Company found that improving ROIC led to more sustainable value than growth.
- S&P Global found that stocks with top-quintile ROIC improvement outperformed the S&P 1500.
- Michael Mauboussin of Credit Suisse showed that differences in ROIC explain the majority of differences in valuation for a wide variety of industries.
Recently, a wider swath of the market seems to be taking notice. Earlier this month, the Wall Street Journal published an article titled The Hottest Metric in Finance: ROIC. The article highlighted activist investors that pushed General Motors (GM) to link executive pay to ROIC.
We’ve been thinking a great deal about this executive compensation issue ourselves. We recently published an article recommending Sally Beauty Holdings (SBH) to investors due in part to its executive compensation program that incentivizes improving ROIC, and we encouraged ROIC-based compensation reforms at Lions Gate (LGF).
Now, we’re taking it a step further and creating a portfolio of stocks that earn our Very Attractive rating and link executive compensation to ROIC. Superior compensation policies represent an underappreciated competitive advantage that should drive these companies to outperform in the future. Limiting the portfolio to Very Attractive stocks ensures that only the most profitable, undervalued stocks make it in.
The Model Portfolio
Only 15 stocks made it into the portfolio. These 15 stocks can be broken up into three groups of five:
- Group 1 have fairly accurate calculations of ROIC and strong links to executive compensation.
- Group 2 have question marks over their ROIC calculations but good links to executive compensation.
- Group 3 have weak links to executive compensation and put more value on metrics such as EPS.
Ultimately, any link between executive compensation and ROIC is better than none, but by using superior calculations and linking a larger percentage of compensation to ROIC, the stocks in Group 1 do the best job of incentivizing shareholder value creation. To be fair, calculating an accurate ROIC is not easy by any means. We have spent millions of dollars on technology to help us collect and model data as accurately as is humanly possible; so our standards may be a little high. Still, we think investors should have high standards in this area.
Figure 1: Stocks With Accurate ROIC Calculations And Strong Links To Executive Comp
 Sources: New Constructs, LLC and company filings
Homebuilder NVR Inc. (NVR) has the highest ROIC in this group—and the entire portfolio—at almost 20%. 50% of long-term option grants vest only if the company earns a return on capital at or near the top of its peer group. NVR’s calculation of return on capital is not perfect, but it is very transparent and close enough to our own calculations to be a fairly good proxy. No company we looked at makes all the adjustments we do to get the most accurate picture of ROIC, but NVR does a pretty good job.
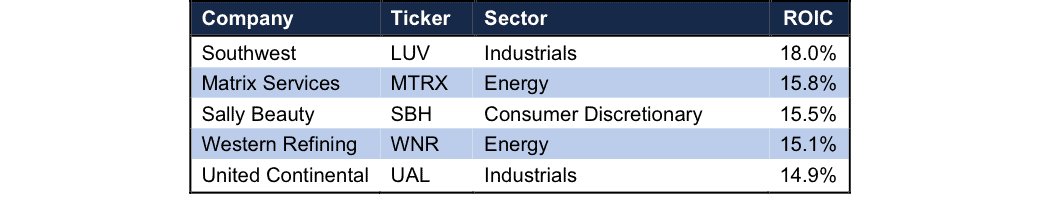
Figure 2: Stocks With Questionable ROIC Calculations But Strong Links To Executive Comp
 Sources: New Constructs, LLC and company filings
On the other hand, the stocks in Figure 2 have some flaws in their ROIC calculations. For instance, airlines Southwest (LUV) and United Continental (UAL) both use a calculation of invested capital that understates the true cost of their aircraft operating leases. Meanwhile, Sally Beauty (SBH) and Matrix Services (MTRX) provide no details as to how they calculate ROIC.
Figure 3: Stocks With Weak Links To Executive Comp
 Sources: New Constructs, LLC and company filings
Meanwhile, the stocks in Figure 3 have only a minimal link between ROIC and executive compensation. Ebay (EBAY) ties the bulk of its bonuses to revenue growth and non-GAAP operating margin, with its (flawed) calculation of ROIC only serving as a modifier to these other metrics.
Ebay and the other companies in Figure 3 still have superior executive compensation practices compared to most of the rest of the market, but not when compared to the stocks in Figure 1.
Value Proposition
People respond to incentives. While the quality of their compensation plans may vary, all of these companies are at least partially incentivizing executives to focus on ROIC, something few other companies are doing. This should push executives to put a greater focus on improving ROIC, which as we showed above is the greatest driver of long-term shareholder value.
In addition to the broader datasets, we’ve seen specific examples of a focus on ROIC leading to outsized returns. In 2006, activist investor Ralph Whitworth took a large stake in Home Depot (HD). One of his major initiatives was to reform executive compensation to put a higher focus on ROIC.
The stock had underperformed for several years prior to Whitworth’s involvement, but it has nearly tripled since and its ROIC has improved from 17% to 21%.
Our perennial favorite AutoZone (AZO) has also thrived by emphasizing ROIC. Whether you look back over a 1, 3, 5, or 10-year period, AZO blows away the S&P 500 in terms of performance. Most notably, AZO has gained 730% over the past decade compared to just 60% for the S&P 500.
All 15 stocks in this portfolio should benefit from executive focus on ROIC. In addition, by including only companies with strong businesses and cheap valuations, we give investors a margin of safety and the potential for outsized returns.
Model Portfolio Methodology
Our methodology for this portfolio is simple. First we only include companies that are classified as Very Attractive based on our five criteria:
- Quality of Earnings (trend of economic GAAP earnings)
- Return On Invested Capital
- Free Cash Flow Yield
- Price to Economic Book Value Per Share
- Market-Implied Growth Appreciation Period
Only 120 out of the 3,000 stocks we cover currently earn our Very Attractive rating.
From there, we simply analyzed the proxy statements of those companies for references to ROIC or alternative terms (such as return on capital employed). Only companies that include a tangible link between ROIC and compensation are included. Many companies reference ROIC as a potential criteria but don’t specifically tie it to compensation.
Disclosure: David Trainer and Sam McBride receive no compensation to write about any specific stock, sector, style, or theme.
4 replies to "Model Portfolio: Executive Compensation Aligned With ROIC"
Barron’s said the model was available for #10!
Glen, the first installment of the model portfolio can be purchased for $9.99 at this link:
https://ao202.infusionsoft.com/app/orderForms/7d8c8dd4-a284-49ad-8531-047d2a9c9b5b
With a Platinum or above membership, you can get access to our monthly updates to the portfolio, along with individual stock reports, stock screeners, in-depth long ideas, and a variety of other resources:
https://www.newconstructs.com/membership/
I am a Platinum member and how do I get the model portfolio that links executive compensation to ROIC?
Ed Schefer
Mr. Schefer,
We will post an update on the blog each month when the newest version of the model portfolio comes out, and that blog post will have a link to the PDF of the report.