Three new stocks make our Linking Exec Comp to ROIC Model Portfolio this month. July’s Linking Exec Comp to ROIC Model Portfolio was made available to members on July 15, 2016.
Recap from June’s Portfolio
Our Linking Exec Comp to ROIC Model Portfolio (+5.0%) outperformed the S&P 500 (+3.9%) last month. The best performing stock in the portfolio was Hawaiian Holdings (HA), which was up nearly 20%. Overall, 10 out of the 15 Exec Comp to ROIC stocks outperformed the S&P 500 in June.
The successes of the Linking Exec Comp to ROIC Model Portfolio stocks highlight the value of our forensic accounting as featured in Barron’s. Return on invested capital (ROIC) is the primary driver of shareholder value creation. By analyzing key details in SEC filings, we are able to calculate an accurate and comparable ROIC for 3000+ companies under coverage.
This Model Portfolio only includes stocks that earn an Attractive or Very Attractive rating and tie executive compensation to improving ROIC. We think this combination provides a uniquely well-screened list of long ideas.
New Stock Feature for July: Matrix Service Company (MTRX: $17/share)
Matrix Service Company (MTRX), engineering, infrastructure, and construction provider, is one of the additions to our Linking Exec Comp to ROIC Model Portfolio in July.
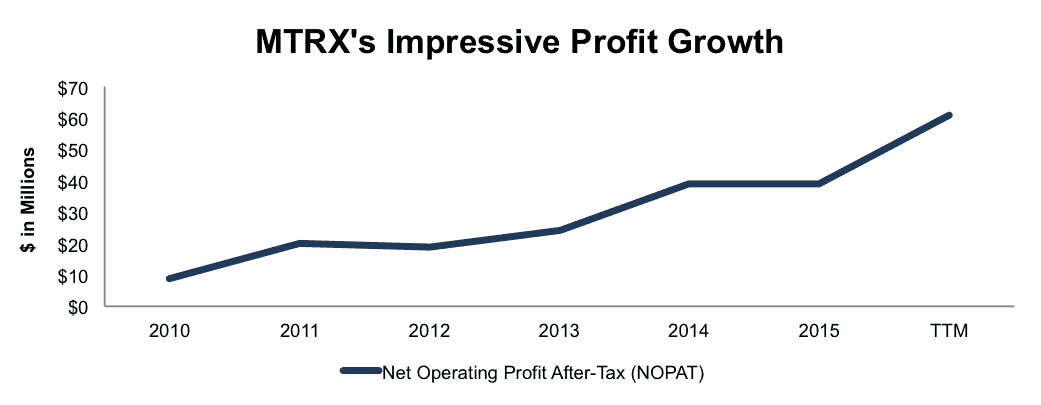
Matrix has built a highly profitable business, especially since the global economic crisis in 2008/2009. Since 2010, Matrix has grown after-tax profit (NOPAT) by an impressive 35% compounded annually to $39 million in 2015. Over the last twelve months, NOPAT has grown to $61 million, per Figure 1.
Figure 1: Matrix’s Strong NOPAT Growth
Sources: New Constructs, LLC and company filings
Executives Incentivized With ROIC Create Shareholder Value
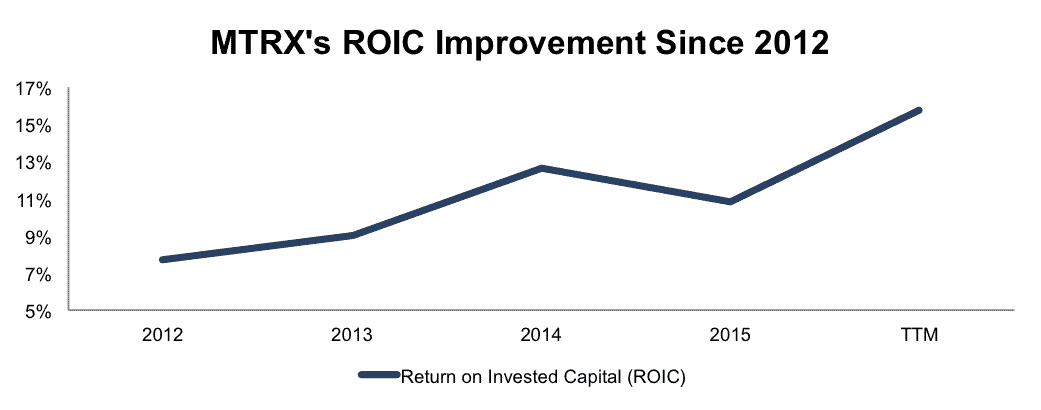
Improvement in ROIC is directly correlated with creating shareholder value. As such, incentivizing executives with ROIC stands to best align their interests with those of shareholders. ROIC was added to Matrix’s executive compensation plan in fiscal 2013. The ensuing improvement in ROIC can be seen in Figure 2 below.
Figure 2: MTRX’s Improving ROIC
Sources: New Constructs, LLC and company filings
Since 2012, Matrix’s ROIC has doubled from 8% to a top-quintile 16%. Over this same timeframe, economic earnings have improved from -$4 million to $26 million and the stock is up nearly 75%, which is greater than the 59% return of the Russell 2000.
In fiscal 2015, Matrix’s short-term incentive plan was based on financial and safety goals. Financial targets represented 80% of total incentive awards and consisted of meeting specific ROIC and operating income goals. For long-term awards, one-third of restricted stock units are tied to the achievement of a 2-year average ROIC.
Investors reduce their risk by investing in company’s like Matrix because the executive compensation plan not only aligns executives with shareholders, but also incentivizes them to create shareholder value.
Current Valuation Implies Permanent Profit Decline
MTRX is down 11% over the last year despite the fundamentals of the business improving. This disconnect has left MTRX significantly undervalued. At its current price of $17/share, MTRX has a price-to-economic book value (PEBV) ratio of 0.7. This ratio means that the market expects Matrix Services’ NOPAT to permanently decline by 30%. This expectation seems rather pessimistic given the company’s long-term history of profit growth. If MTRX can grow NOPAT by just 5% compounded annually for the next decade, the stock is worth $21/share today – a 24% upside. Upside potential coupled with executives aligned with shareholder interests make MTRX a great addition to July’s Linking Executive Compensation to ROIC Model Portfolio.
Impacts of Footnotes Adjustments And Forensic Accounting
Calculating ROIC is easy. Calculating an accurate ROIC is not easy. In order to derive the true recurring cash flows, an accurate invested capital, and an accurate shareholder value, we made the following adjustments to Matrix Service’s 2015 10-K:
Income Statement: we made $94 million of adjustments, with a net effect of removing $22 million in non-operating expense (2% of revenue). We removed $36 million in non-operating income and $58 million in non-operating expenses. You can see all the adjustments made to MTRX’s income statement here.
Balance Sheet: we made $105 million of adjustments to calculate invested capital with a net increase of $60 million. One of the largest adjustments was $76 million due to asset write-downs. This adjustment represented 25% of reported net assets. You can see all the adjustments made to MTRX’s balance sheet here.
Valuation: we made $35 million of adjustments with a net effect of increasing shareholder value by $17 million. The largest adjustment was the removal of $20 million in off-balance-sheet operating leases. This adjustment represents 4% of Matrix’s market cap. Despite the decrease in shareholder value, MTRX remains undervalued.
This article originally published here on July 21, 2016.
Disclosure: David Trainer and Kyle Guske II receive no compensation to write about any specific stock, style, or theme.

