
Four new stocks make our Exec Comp Aligned With ROIC Model Portfolio this month. April’s Exec Comp Aligned With ROIC Model Portfolio was made available to members on 4/13/17.
Recap from March’s Picks
Our Exec Comp Aligned With ROIC Model Portfolio (-0.4%) outperformed the S&P 500 (-1.3%) last month. The best performing stock in the portfolio was Kimball International (KBAL), which was up 7%. Overall, eight out of the 15 Exec Comp To ROIC Stocks outperformed the S&P in March.
Since inception, this model portfolio is up 23% while the S&P 500 is up 11%.
The success of this Model Portfolio highlights the value of our robo-analyst technology that scales our forensic accounting expertise (featured in Barron’s) across the footnotes in 10-Ks for 3000+ companies under coverage.
This Model Portfolio only includes stocks that earn an Attractive or Very Attractive rating and align executive compensation with improving ROIC. We think this combination provides a uniquely well-screened list of long ideas because return on invested capital (ROIC) is the primary driver of shareholder value creation.
New Stock Feature for April: Foot Locker, Inc. (FL: $73/share)
Foot Locker (FL) is one of the additions to our Exec Comp Aligned With ROIC Model Portfolio in April. We featured Foot Locker in May 2015 when we highlighted its ability to consistently grow profits amidst retail competition. Since then, FL is up 14% while the S&P 500 is up 10% yet the stock remains undervalued.
Since 2010, Foot Locker has grown after-tax profit (NOPAT) by 26% compounded annually to $778 million in 2017. Per Figure 1, Foot Locker’s NOPAT margin has grown from 3% in 2010 to 10% in 2017.
Figure 1: Foot Locker’s Improving Profitability
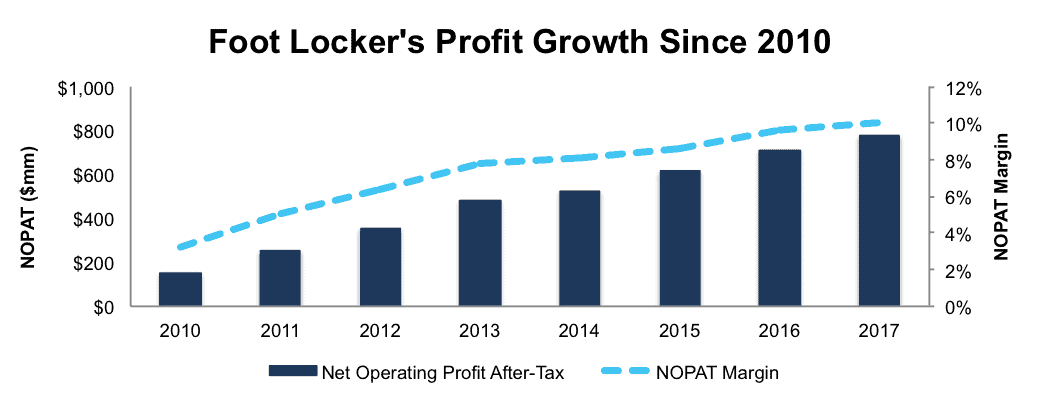
Sources: New Constructs, LLC and company filings
Foot Locker currently earns an 11% return on invested capital (ROIC) and has generated a cumulative $761 million (8% of market cap) in free cash flow over the past five years.
Executive Compensation Plan Incentivizes Shareholder Value Creation
Foot Locker has aligned executive compensation with ROIC since at least 1996, which is the earliest available electronic filing. In 2016, 30% of Foot Locker’s long-term plan is tied to a two-year average ROIC. This long-term incentive plan represents 67% of the CEO’s pay and 58% of other executives’ pay.
The focus on ROIC helps ensure executives are good stewards of capital. Per Figure 2, Foot Locker has improved its ROIC from 3% in 2010 to 11% in 2017.
Figure 2: Improving ROIC Improves Shareholder Value
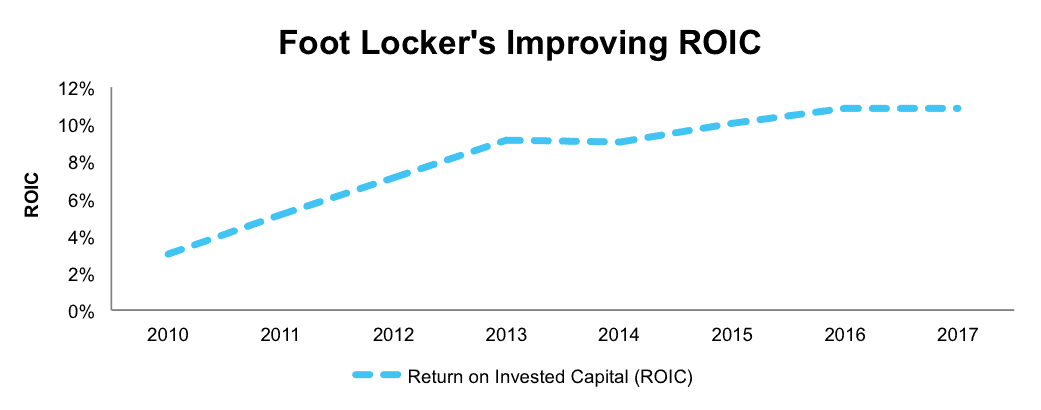
Sources: New Constructs, LLC and company filings
We have detailed ways in which ROIC is directly correlated to changes in shareholder value here. FL’s use of return on invested capital to measure performance ensures executives’ interests are aligned with shareholders’ interests.
FL Is Undervalued Despite Strong Fundamentals
Investors have clearly rewarded Foot Locker for its improving fundamentals and the stock is up 135% over the past five years, while the S&P 500 is up 67%. Despite the increase in stock price, FL remains undervalued.
At its current price of $73/share, FL has a price to economic book value (PEBV) ratio of 0.7. This ratio means the market expects FL’s NOPAT to permanently decline by 30%. This expectation seems rather pessimistic for a firm that has grown NOPAT by 26% compounded annually since 2010. Longer-term, FL has grown NOPAT by 5% compounded annually since 1998.
If Foot Locker can maintain current NOPAT margins (10%) and grow NOPAT by just 4% compounded annually over the next five years, the stock is worth $114/share today – a 56% upside.
Impacts of Footnotes Adjustments and Forensic Accounting
Our robo-analyst technology enables us to perform forensic accounting with scale and provide the research needed to fulfill fiduciary duties.
In order to derive the true recurring cash flows, an accurate invested capital, and an accurate shareholder value, we made the following adjustments to FL’s 2017 10-K:
Income Statement: we made $352 million of adjustments, with a net effect of removing $114 million in non-operating expense (1% of revenue). We removed $119 million in non-operating income and $233 million in non-operating expenses. You can see all the adjustments made to FL’s income statement here.
Balance Sheet: we made $6 billion of adjustments to calculate invested capital with a net increase of $3.9 billion. One of the largest adjustments was $3.5 billion due to operating leases. This adjustment represented 110% of reported net assets. You can see all the adjustments made to FL’s balance sheet here.
Valuation: we made $4.5 billion of adjustments with a net effect of decreasing shareholder value by $3.1 billion. Apart from total debt, which includes the operating leases noted above, one of the largest adjustments to shareholder value was $664 million in excess cash. This adjustment represents 7% of FL’s market cap. Despite the net decrease in shareholder value, FL remains undervalued.
This article originally published on April 18, 2017.
Disclosure: David Trainer and Kyle Guske II receive no compensation to write about any specific stock, style, or theme.
Follow us on Twitter, Facebook, LinkedIn, and StockTwits for real-time alerts on all our research.
Click here to download a PDF of this report.
Photo Credit: Andreas Poike (Flickr)