Two new stocks make our Exec Comp Aligned With ROIC Model Portfolio this month. January’s Exec Comp Aligned With ROIC Model Portfolio was made available to members on 1/13/17.
Recap from December’s Picks
Our Exec Comp Aligned With ROIC Model Portfolio (-0.7%) underperformed the S&P 500 (+0.2%) last month. The best performing stock in the portfolio was Lear Corp (LEA: $143/share), which was up 7%. Overall, seven out of the 15 Exec Comp Aligned With ROIC Stocks outperformed the S&P in December.
Since inception, this model portfolio is up 22% while the S&P 500 is up 9%.
The success of the Exec Comp Aligned With ROIC Model Portfolio highlights the value of our forensic accounting (featured in Barron’s). Return on invested capital (ROIC) is the primary driver of shareholder value creation. By analyzing footnotes in SEC filings, we are able to calculate an accurate and comparable ROIC for 3000+ companies under coverage.
This Model Portfolio only includes stocks that earn an Attractive or Very Attractive rating and align executive compensation with improving ROIC. We think this combination provides a uniquely well-screened list of long ideas.
New Stock Feature for January: The Walt Disney Company (DIS: $108/share)
Walt Disney Company (DIS), media & entertainment conglomerate, is one of the additions to our Exec Comp Aligned With ROIC Model Portfolio in January. We recently featured Disney as a Long Idea, and management’s decision to align executive compensation with ROIC makes it even more compelling.
Over the past decade, Disney has grown after-tax profit (NOPAT) by 9% compounded annually while improving its NOPAT margin from 12% in 2006 to 18% in 2016, per Figure 1.
Figure 1: Profit Growth At Disney
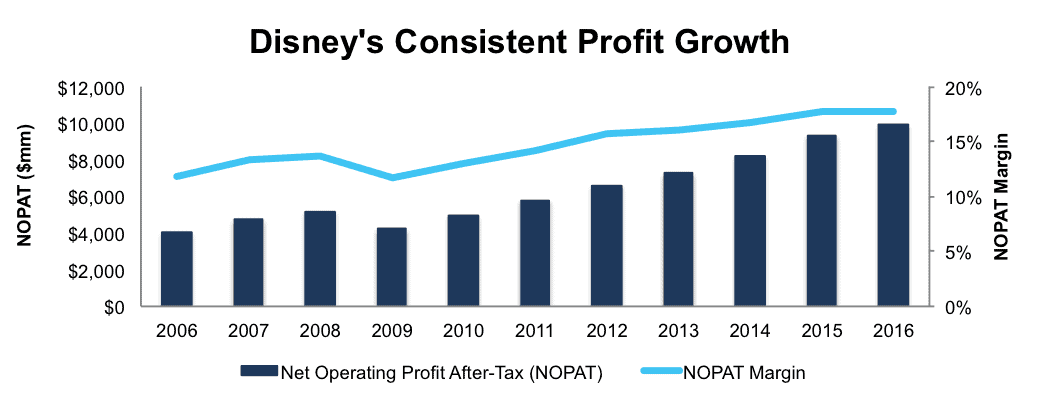
Sources: New Constructs, LLC and company filings
The company currently earns a 12% return on invested capital (ROIC) and has generated a cumulative $23.7 billion in free cash flow (FCF) over the past five years.
Executive Compensation Aligned With ROIC Creates Shareholder Value
Disney added return on invested capital to its executive compensation plan in 2009 and now places heavy emphasis on the metric to evaluate corporate performance. Roughly 90% of compensation for Disney executives comes in the form of performance-based bonuses. 25% of performance-based compensation is tied to ROIC. Best of all, Disney calculates ROIC in a fairly rigorous manner (better than most) that lines up well with economic reality.
The focus on ROIC helps make executives good stewards of investors’ capital. Per Figure 2, Disney’s ROIC has improved from 8% in 2008 to 12% in 2016. Longer term, ROIC has improved from 2% in 2002 to its current 12%.
Figure 2: Improvement In ROIC Since 2002
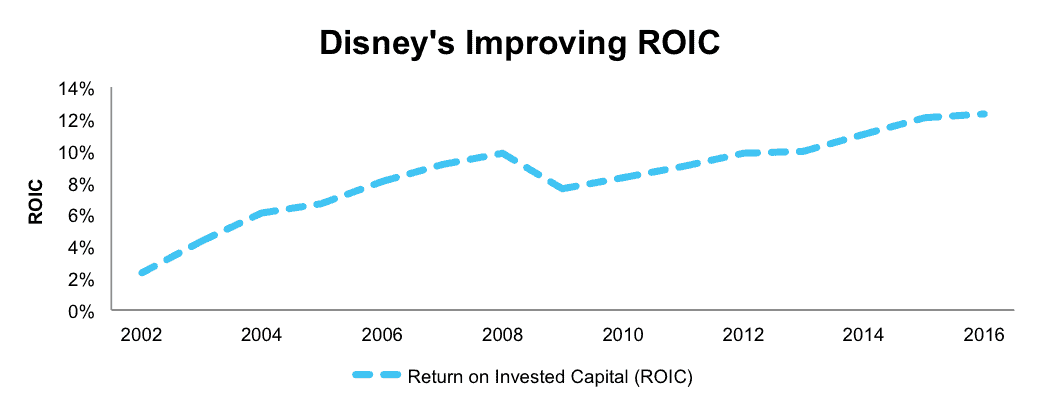
Sources: New Constructs, LLC and company filings
We’ve detailed ways in which ROIC is directly correlated to changes in shareholder value here, and Disney’s use of ROIC to measure performance ensures executives’ interests are aligned with shareholders’.
Disney Remains Undervalued Despite Solid Fundamentals
Despite the history of profit growth and improvement in ROIC highlighted above, DIS remains significantly undervalued.
At its current price of $108/share, Disney has a price to economic book value (PEBV) ratio of just 1.2, which implies that the market expects that the company will grow NOPAT by no more than 20% over the remainder of its corporate life.
If Disney can grow NOPAT by just 4% compounded annually over the next 15 years, the stock is worth $137/share today – a 26% upside. This expectation seems rather pessimistic given that Disney has grown NOPAT by 15% compounded annually over the past 15 years.
Impacts of Footnotes Adjustments and Forensic Accounting
In order to derive the true recurring cash flows, an accurate invested capital, and a real shareholder value, we made the following adjustments to Disney’s 2016 10-K:
Income Statement: we made $3.2 billion of adjustments with a net effect of removing $498 million in non-operating expense (1% of revenue). We removed $1.8 billion related to non-operating expenses and $1.3 billion related to non-operating income. See all adjustments made to DIS’s income statement here.
Balance Sheet: we made $17.5 billion of adjustments to calculate invested capital with a net increase of $5.2 billion. The most notable adjustment was $4 billion (5% of reported net assets) related to other comprehensive income. See all adjustments to DIS’s balance sheet here.
Valuation: we made $41 billion of adjustments with a net effect of decreasing shareholder value by $33.6 billion. The largest adjustment to shareholder value was $23.5 billion in total debt, which includes $2.4 billion in off-balance sheet debt. This off-balance sheet debt adjustment represents 1% of Disney’s market value. Despite the net decrease in shareholder value, DIS remains undervalued.
This article originally published here on January 18, 2017.
Disclosure: David Trainer, Kyle Guske II, and Kyle Martone receive no compensation to write about any specific stock, style, or theme.
Scottrade clients get a Free Gold Membership ($588/yr value) as well as 50% discounts and up to 20 free trades ($140 value) for signing up to Platinum, Pro or Unlimited memberships. Login or open your Scottrade account & find us under Quotes & Research/Investor Tools.