Recap from January’s Picks
Most Attractive Large Cap stock KLA Tencor (KLAC) gained 7% last month. Most Attractive Small Cap stock Wabash National Corp (WNC) was up 9%. Overall, 20 out of the 40 Most Attractive stocks outperformed the S&P 500 in January.
Our Most Dangerous Stocks (-0.8%) outperformed the S&P 500 (+0.4%) last month. Most Dangerous Large Cap stock Ternium S.A. (TX) fell by 7%. Most Dangerous Small Cap Stock Build-A-Bear Workshop (BBW) fell by 16%. Overall, 24 out of the 40 Most Dangerous stocks outperformed the S&P 500 in January.
The successes of the Most Attractive and Most Dangerous stocks highlight the value of our forensic accounting as featured in Barron’s. Our research helps clients fulfill fiduciary duties when making investment decisions.
21 new stocks make our Most Attractive list this month and 11 new stocks fall onto the Most Dangerous list this month. February’s Most Attractive and Most Dangerous stocks were made available to members on 2/2/17.
Our Most Attractive stocks have high and rising returns on invested capital (ROIC) and low price to economic book value ratios. Most Dangerous stocks have misleading earnings and long growth appreciation periods implied by their market valuations.
Most Attractive Stocks Feature for February: Cracker Barrel Old Country Store (CBRL: $158/share)
Cracker Barrel Old Country Store (CBRL), retail store and restaurant, is one of the additions to our Most Attractive stocks for February.
Over the past decade, Cracker Barrel has grown after-tax profit (NOPAT) by 4% compounded annually to $217 million in 2016. NOPAT has increased to $225 million over the last twelve months (TTM). Per Figure 1, Cracker Barrel has also improved its NOPAT margin from 6% in 2006 to 8% TTM.
Figure 1: Cracker Barrel’s Improving Profitability
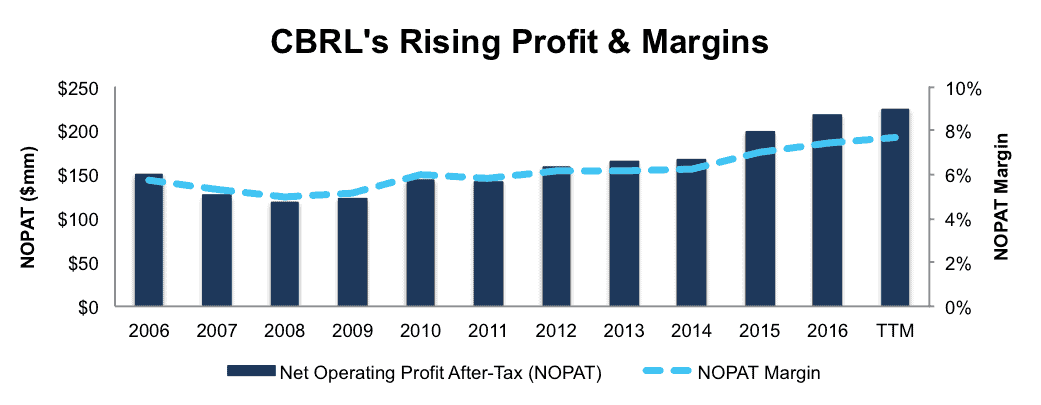
Sources: New Constructs, LLC and company filings
Cracker Barrel currently earns a 14% return on invested capital (ROIC) and has generated a cumulative $886 million in free cash flow over the past five years.
Impacts of Footnotes Adjustments and Forensic Accounting
In order to derive the true recurring cash flows, an accurate invested capital, and an accurate shareholder value, we made the following adjustments to Cracker Barrel’s 2016 10-K:
Income Statement: we made $60 million of adjustments, with a net effect of removing $28 million in non-operating expense (1% of revenue). We removed $16 million in non-operating income and $44 million in non-operating expenses. You can see all the adjustments made to CBRL’s income statement here.
Balance Sheet: we made $614 million of adjustments to calculate invested capital with a net increase of $458 million. One of the largest adjustments was $450 million due to operating leases. This adjustment represented 40% of reported net assets. You can see all the adjustments made to CBRL’s balance sheet here.
Valuation: we made $905 million of adjustments with a net effect of decreasing shareholder value by $905 million. There were no adjustments that increased shareholder value. Apart from total debt, the largest adjustment to shareholder value was $54 million in deferred tax liabilities. This adjustment represents less than 1% of Cracker Barrel’s market cap. Despite the decrease in shareholder value, CBRL remains undervalued.
CBRL Represents Quality Risk/Reward
The market has rewarded Cracker Barrel for its consistent profit growth, and the stock is up 180% over the past five years (S&P 500 up 68%). In spite of this price increase, shares remain undervalued. At its current price of $158/share, Cracker Barrel has a price to economic book value (PEBV) ratio of 1.0. This ratio means the market expects Cracker Barrel never to grow profits for the remainder of its corporate life. This expectation seems rather pessimistic for a company that has grown NOPAT by 4% compounded annually for the past decade.
If Cracker Barrel can maintain 2016 NOPAT margins (8%) and grow NOPAT by just 3% compounded annually for the next decade, the stock is worth $195/share today – a 23% upside. Add in Cracker Barrel’s 2.9% dividend yield, and CBRL makes a nice addition to this month’s Most Attractive Stocks Model Portfolio.
Most Dangerous Stocks Feature: Bottomline Technologies (EPAY: $26/share)
Bottomline Technologies (EPAY), cloud based payment and banking provider, is one of the additions to our Most Dangerous stocks for February. Bottomline was also a Danger Zone pick in January 2016. Since then, the stock is up 4% (S&P up 1%) and is now more overvalued.
Since 2011, Bottomline Technologies’ NOPAT has declined by 21% compounded annually to $3 million in 2016. NOPAT has fallen further to -$2 million TTM. This deterioration in profits occurred despite revenue growing 13% compounded annually during the same period, per Figure 1.
Figure 2: Bottomline Technologies’ Meaningless Revenue Growth
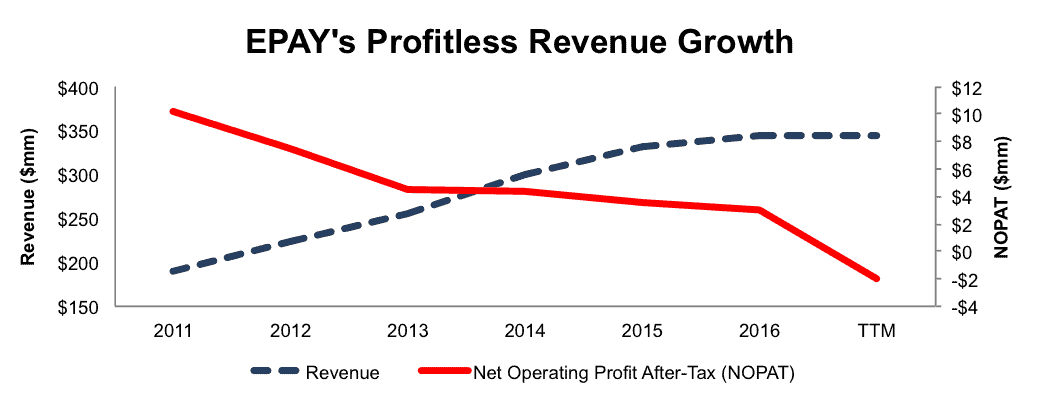
Sources: New Constructs, LLC and company filings
Bottomline’s ROIC has fallen from 5% in 2011 to a bottom-quintile 0% TTM. The company has also burned through a cumulative $240 million in FCF over the past five years.
Impacts of Footnotes Adjustments and Forensic Accounting
In order to derive the true recurring cash flows, an accurate invested capital, and an accurate shareholder value, we made the following adjustments to Bottomline Technologies’ 2016 10-K:
Income Statement: we made $25 million of adjustments with a net effect of removing $23 million in non-operating expense (7% of revenue). We removed $1 million related to non-operating income and $24 million related to non-operating expenses. See all the adjustments made to EPAY’s income statement here.
Balance Sheet: we made $238 million of adjustments to calculate invested capital with a net decrease of $20 million. The most notable adjustment was $38 million (7% of reported net assets) related to other comprehensive income. See all adjustments to EPAY’s balance sheet here.
Valuation: we made $355 million of adjustments with a net effect of decreasing shareholder value by $133 million. The largest adjustment to shareholder value was $199 million in total debt, which includes $26 million in off-balance-sheet operating leases. This lease adjustment represents 3% of EPAY’s market cap.
EPAY Is Priced to Perfection
To justify its current price of $26/share, EPAY must achieve NOPAT margins of 5% (highest ever achieved by firm in 2011, compared to -1% TTM) and grow NOPAT by 33% compounded annually for the next 12 years. This scenario seems overly optimistic given Bottomline’s NOPAT has declined 21% compounded annually since 2011.
Even if we assume EPAY can achieve 5% NOPAT margins and grow NOPAT by 29% compounded annually for the next decade, the stock is worth only $11/share today – a 58% downside. This scenario assumes EPAY grows revenue by 9% compounded annually. The significant increase in margin (5% vs. -1% TTM) causes the large increase in NOPAT growth.
Each of these scenarios also assumes EPAY is able to grow revenue and NOPAT/free cash flow without spending on working capital or fixed assets. This assumption is unlikely but allows us to create very optimistic scenarios that demonstrate how high expectations in the current valuation are. For reference, EPAY’s invested capital has grown on average $38 million (11% of 2016 revenue) per year over the last ten years.
This article originally published here on February 9, 2017.
Disclosure: David Trainer, Kyle Guske II, and Kyle Martone receive no compensation to write about any specific stock, style, or theme.
Scottrade clients get a Free Gold Membership ($588/yr value) as well as 50% discounts and up to 20 free trades ($140 value) for signing up to Platinum, Pro, or Unlimited memberships. Login or open your Scottrade account & find us under Quotes & Research/Investor Tools.