Recap from June’s Picks
Our Most Attractive Stocks (+0.2%) outperformed the S&P 500 (0.0%) last month. Most Attractive Large Cap stock Federated Investors (FII) gained 10%. Most Attractive Small Cap stock Pzena Investment Management (PZN) was up 17%. Overall, 24 out of the 40 Most Attractive stocks outperformed the S&P 500 in June.
Our Most Dangerous Stocks (+2.4%) underperformed the S&P 500 (0.0%) as a short portfolio last month. Most Dangerous Large Cap stock Salesforce.com (CRM) fell by 4%. Most Dangerous Small Cap Stock CIRCOR International (CIR) fell by 8%. Overall, 17 out of the 40 Most Dangerous stocks outperformed the S&P 500 in June.
The successes of the Most Attractive and Most Dangerous stocks highlight the value of our Robo-Analyst technology, which helps clients fulfill the fiduciary duty of care when making investment recommendations.
12 new stocks make our Most Attractive list this month and seven new stocks fall onto the Most Dangerous list. July’s Most Attractive and Most Dangerous stocks were made available to members on July 7, 2017.
Our Most Attractive stocks have high and rising returns on invested capital (ROIC) and low price to economic book value ratios. Most Dangerous stocks have misleading earnings and long growth appreciation periods implied by their market valuations.
Most Attractive Stocks Feature: Ross Stores (ROST: $55/share)
Ross Stores (ROST), a discount apparel and home fashion retailer, is one of the additions to our Most Attractive stocks for July. ROST was also recently featured in our article “5 Unappreciated Stocks with High ROICs.” ROST is one of the few retailers thriving in an Amazon-dominated world. The company’s strategic focus on offering high-end brands at discount prices to the moderate-income consumer has proven very successful over time.
Per Figure 1, revenue has grown 8% compounded annually and after-tax profit (NOPAT) has grown 16% compounded annually over the past decade. NOPAT growth has exceeded revenue growth due to ROST’s improving NOPAT margin, which has risen from 5% in 2007 to 9% over the last twelve months (TTM).
Figure 1: Ross’ Revenue & NOPAT Margin Over Past Decade
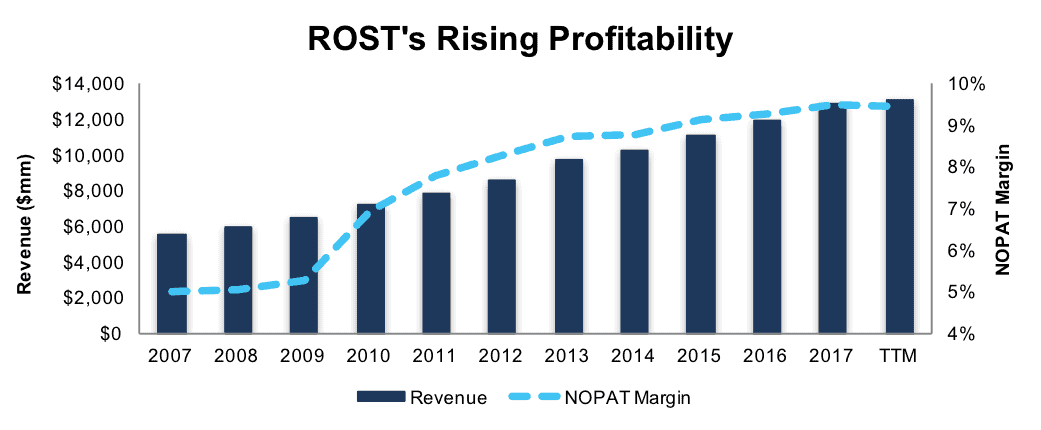
Sources: New Constructs, LLC and company filings
ROST’s return on invested capital (ROIC) has improved from 12% in 2007 to a top-quintile 21% TTM. In addition, ROST has generated $2.7 billion (13% of market cap) in free cash flow (FCF) over the past five years.
Low Expectations Baked Into Stock Price
ROST is down 17% YTD while the S&P 500 is up 8%. This decline has brought its valuation to a level that provides an attractive risk/reward trade-off. At its current price of $55/share, ROST has a price-to-economic book value (PEBV) ratio of 1.0. This ratio means the market expects NOPAT to never grow from current levels. This expectation seems too pessimistic given ROST’s impressive NOPAT growth over the past decade.
If ROST can maintain TTM NOPAT margins (9%) and grow NOPAT by just 5% compounded annually for the next decade, the stock is worth $75/share today – a 36% upside.
Impacts of Footnotes Adjustments and Forensic Accounting
Our Robo-Analyst technology enables us to perform forensic accounting with scale and provide the research needed to fulfill fiduciary duties. In order to derive the true recurring cash flows, an accurate invested capital, and an accurate shareholder value, we made the following adjustments to Ross’ 2017 10-K:
Income Statement: we made $211 million of adjustments, with a net effect of removing $101 million in non-operating expense (1% of revenue). We removed $55 million in non-operating income and $156 million in non-operating expenses. You can see all the adjustments made to ROST’s income statement here.
Balance Sheet: we made $3.3 billion of adjustments to calculate invested capital with a net increase of $2.2 billion. One of the largest adjustments was $2.8 billion due to operating leases. This adjustment represented 77% of reported net assets. You can see all the adjustments made to ROST’s balance sheet here.
Valuation: we made $3.9 billion of adjustments with a net effect of decreasing shareholder value by $2.7 billion. Apart from total debt, which includes the operating leases noted above, the largest adjustment to shareholder value was $591 million in excess cash. This adjustment represents 3% of ROST’s market cap.
Most Dangerous Stocks Feature: McDermott International (MDR: $7.25/share)
McDermott International (MDR), an equipment and services provider to the oil and gas industry, is one of the additions to our Most Dangerous stocks for July. The weakness in MDR’s business stretches far beyond the 2014 crash in oil prices, yet the stock remains priced for significant profit growth.
Over the past decade, MDR’s revenue has declined 4% compounded annually to $2.6 billion in 2016 and $2.4 billion TTM. Per Figure 2, MDR’s NOPAT has fallen 9% compounded annually over the same time frame, as the company’s NOPAT margin fell from 8% in 2006 to 5% TTM.
Figure 2: McDermott’s Profitability Over the Past Decade
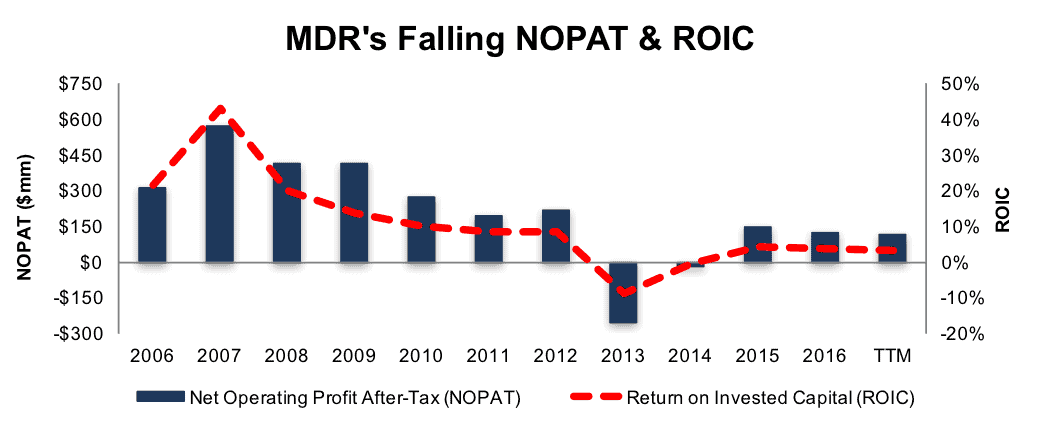
Sources: New Constructs, LLC and company filings
McDermott’s ROIC fell from 22% in 2006 to a bottom-quintile 3% TTM. Making matters worse, MDR’s has burned through a cumulative $633 million (31% of market cap) in free cash flow over the past five years.
MDR Remains Overvalued
Investors have clearly recognized MDR’s struggles, and the stock is down nearly 36% over the past five years. However, the market has driven shares up 46% in the past year while the S&P 500 is up just 13%. This price increase amid continued fundamental deterioration makes MDR significantly overvalued.
To justify its current price of $7.25/share, MDR must maintain TTM NOPAT margins (5%) and grow NOPAT by 7% compounded annually for the next decade. Such a scenario seems overly optimistic given MDR’s falling revenues, margins and NOPAT over the past decade.
Even if MDR is able to maintain TTM NOPAT margins and grow NOPAT by 5% compounded annually for the next decade, the stock is worth only $5.65/share today – a 22% downside.
Each of these scenarios also assumes MDR is able to grow revenue and NOPAT/FCF without increasing working capital or investing in fixed assets. This assumption is very unlikely but allows us to create scenarios that demonstrate how high expectations embedded in the current valuation truly are. For reference, MDR’s invested capital has grown by an average of $169 million (6% of revenue) per year over the past five years.
Impacts of Footnotes Adjustments and Forensic Accounting
Our Robo-Analyst technology enables us to perform forensic accounting with scale and provide the research needed to fulfill fiduciary duties. In order to derive the true recurring cash flows, an accurate invested capital, and an accurate shareholder value, we made the following adjustments to McDermott’s 2016 10-K:
Income Statement: we made $239 million of adjustments, with a net effect of removing $89 million in non-operating expenses (3% of revenue). We removed $75 million in non-operating income and $164 million in non-operating expenses. You can see all the adjustments made to MDR’s income statement here.
Balance Sheet: we made $1.8 billion of adjustments to calculate invested capital with a net increase of $772 million. One of the largest adjustments was $918 million due to asset write-downs. This adjustment represented 37% of reported net assets. You can see all the adjustments made to MDR’s balance sheet here.
Valuation: we made $1.5 billion of adjustments with a net effect of decreasing shareholder value by $496 million. The largest adjustment to shareholder value was $932 million in total debt, which includes $167 million in off-balance sheet operating leases. This lease adjustments represents 8% of MDR’s market cap.
This article originally published on July 12, 2017.
Disclosure: David Trainer, Kyle Guske II, Kenneth James receive no compensation to write about any specific stock, style, or theme.
Follow us on Twitter, Facebook, LinkedIn, and StockTwits for real-time alerts on all our research.
2 replies to "New Stocks on Most Attractive/Most Dangerous: July 2017"
The info and calculation you provided might be correct but leaves a negative summary.
I bought this stock in 2015 and 2016 for as low as $2.20 and booked a handsome 300% plus profit in the meantime well over a 7 digit dollar number.
This stock has an excellence performance if you look at the bottom line over the last 3 years. A stock hard to find giving a monster return for me.
It’s true, MDR shareholders have profited handsomely over the past couple years. The problem is that the big increase in the stock price has taken it from cheap to overvalued, and the profitability of the company continues to deteriorate. GAAP net income was artificially depressed in 2015 due to pension and legal charges, which has created the illusion of profit growth in 2016 and 2017 when in fact NOPAT and ROIC have declined.