10 new stocks make our Safest Dividend Yield Model Portfolio this month. November’s Safest Dividend Yield Model Portfolio was made available to members on November 22, 2016.
Recap from October’s Picks
Our Safest Dividend Yield Model Portfolio (+6.8%) outperformed the S&P 500 (+2.5%) last month. The best performing stocks in the portfolio were large cap stock Kohl’s Corporation (KSS), which was up 25%, and small cap stock, Inteliquent (IQNT), which was up 35%. Overall, 12 out of the 20 Safest Dividend Yield stocks outperformed the S&P in October.
The success of the Safest Dividend Yield Model Portfolio highlights the value of our forensic accounting (featured in Barron’s). Companies with strong free cash flow provide higher quality and safer dividend yields because we know they have the cash to support the dividend. By analyzing footnotes in SEC filings, we are able to calculate cash flow more accurately and diligently for 3000+ companies under coverage.
This Model Portfolio only includes stocks that earn an Attractive or Very Attractive rating, have positive free cash flow and economic earnings, and offer a dividend yield greater than 3%. We think this combination provides a uniquely well-screened group of stocks that can deliver returns greater than the market.
New Stock Feature for November Cummins Inc. (CMI: $137/share)
Cummins Inc. (CMI), diesel and natural gas engine manufacturer, is one of the additions to our Safest Dividend Yield Model Portfolio in November.
Over the past decade, Cummins has grown after-tax profit (NOPAT) by 10% compounded annually and currently earns an 11% return on invested capital (ROIC). Over the same time, Cummins has increased its dividend payment from $0.09/quarter in 4Q06 to $1.02/quarter in 4Q16. Figure 2 provides details on CMI’s dividend growth over the last five years. CMI’s dividend currently yields 3% compared to 2% for the S&P 500.
Figure 1: Dividend Growth Since 4Q11
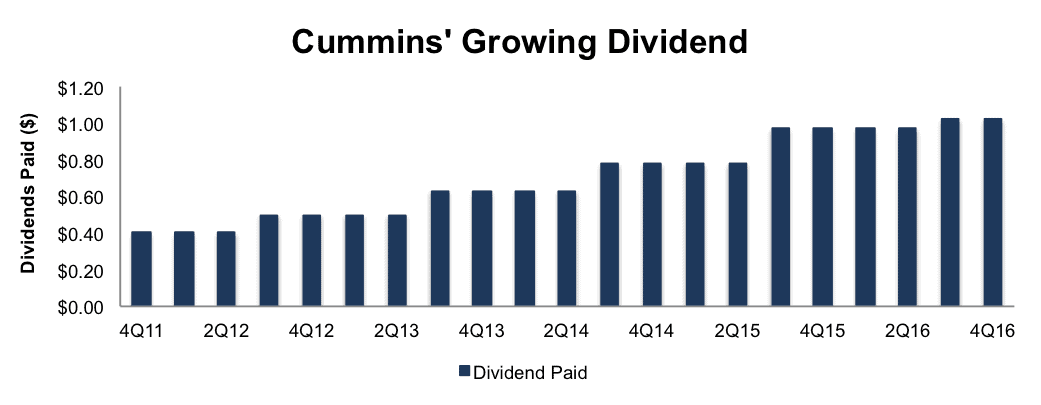
Sources: New Constructs, LLC and company filings
Rising Free Cash Flow Aids In Dividend Security
As with all companies in the Safest Dividend Yield Model Portfolio, Cummins earns positive free cash flow and economic earnings. In fact, CMI has generated positive FCF every year since 2008, to the tune of cumulative $4.6 billion, per Figure 2. Companies with strong free cash flow provide higher quality dividend yields because we know the firm has the cash to support its dividend. On the flip side, dividend yields from companies with low or negative free cash flow cannot be trusted as much because the company may not be able to sustain such a high dividend for much longer.
Figure 2: Improving Free Cash Flow

Sources: New Constructs, LLC and company filings
Despite Price Increase, CMI Remains Undervalued
Despite Cummins’ share price increasing 58% year-to-date, shares remain undervalued. At its current price of $137/share, CMI has a price-to-economic book value (PEBV) ratio of 1.3. This ratio means the market expects CMI’s NOPAT to grow by only 30% over the remainder of its corporate life. Such expectations seem pessimistic for a firm that has grown profits by 10% compounded annually over the past decade.
If Cummins can achieve 9% NOPAT margins (5 year average, and TTM margin) and grow NOPAT by just 6% compounded annually for the next decade, the stock is worth $161/share today – an 18% upside. Coupled with CMI’s 3% dividend yield, this stock provides a great low risk/ high reward opportunity.
Impacts of Footnotes Adjustments and Forensic Accounting
In order to derive the true recurring cash flows, an accurate invested capital, and a real shareholder value, we made the following adjustments to Cummins’ 2015 10-K:
Income Statement: we made $1.3 billion of adjustments with a net effect of removing $339 million in non-operating expense (2% of revenue). We removed $836 million related to non-operating expenses and $497 million related to non-operating income. See all adjustments made to CMI’s income statement here.
Balance Sheet: we made $4.1 billion of adjustments to calculate invested capital with a net increase of $1.1 billion. The most notable adjustment was $1.4 billion (12% of reported net assets) related to other comprehensive income. See all adjustments to CMI’s balance sheet here.
Valuation: we made $3.5 billion of adjustments with a net effect of decreasing shareholder value by $2.2 billion. The largest adjustment to shareholder value was the removal of $2.5 billion in total debt, which includes $555 million in off-balance sheet operating leases. This lease adjustment represents 2% of CMI’s market value. Despite the net decrease in shareholder value, CMI remains undervalued.
This article originally published here on November 23, 2016.
Disclosure: David Trainer, Kyle Guske II, and Kyle Martone receive no compensation to write about any specific stock, style, or theme.
Scottrade clients get a Free Gold Membership ($588/yr value) as well as 50% discounts and up to 20 free trades ($140 value) for signing up to Platinum, Pro or Unlimited memberships. Login or open your Scottrade account & find us under Quotes & Research/Investor Tools.