
The COVID-19-induced economic downturn wiped out eight quarters of core earnings growth in just two quarters, as we highlighted in “S&P 500 Peaks As Earnings Trough.” This report focuses on the core earnings of each S&P 500 sector to narrow in on where the most damage was done.
Our measure of core earnings leverages cutting-edge technology to provide clients with a cleaner and more comprehensive view of earnings[1]. Investors armed with our measure of core earnings have a differentiated and more informed view of the fundamentals of companies and sectors.
Within the S&P 500, only the Technology sector saw a rise in core earnings since the end of 2019, as the shift to work-from-home drove growth in many technology companies.
Rankings the Sectors by Core Earnings Growth
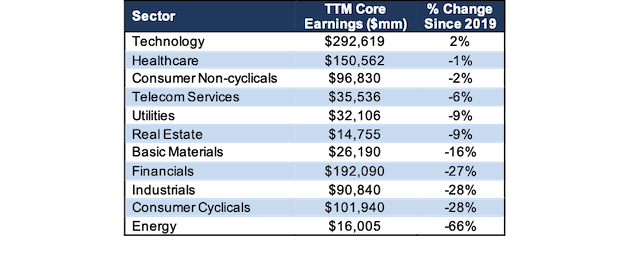
Figure 1 ranks all 11 S&P 500 sectors by the change in core earnings from the end of 2019 through 8/11/20.
Figure 1: TTM Core Earnings Through 8/11/20 vs. Last Year by S&P 500 Sector
Sources: New Constructs, LLC and company filings.
Our Core Earnings analysis is based on aggregated TTM data for the sector constituents.
The Technology sector generates the most core earnings by far, and grew core earnings by 2% since 2019. On the flip side, the Energy sector has the second lowest core earnings, and the largest drop since the end of 2019. Plummeting oil prices in early March followed by the COVID-19 shutdowns across the globe hit the energy sector hardest.
Details on the S&P 500 Sectors
Figures 2-12 compare the core earnings and GAAP net income trends for every S&P 500 sector since 2004.
Basic Materials
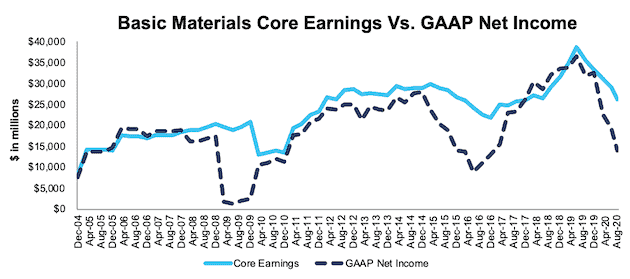
Figure 2 shows core earnings for the Basic Materials sector peaked in mid 2019 and have fallen 32% since then. Asset write-downs, which occurred at record levels through the first half of 2020, help explain the large disconnect between core earnings and GAAP net income.
Dow Inc. (DOW) and Dupont De Nemours (DD), combined, incurred write-downs down over $6 billion TTM, which equals 24% of the Basic Materials sector’s TTM core earnings.
Figure 2: Basic Materials Core Earnings Vs. GAAP: 2004 – 8/11/20
Sources: New Constructs, LLC and company filings.
Our Core Earnings analysis is based on aggregated TTM data for the sector constituents in each measurement period.
Consumer Cyclicals
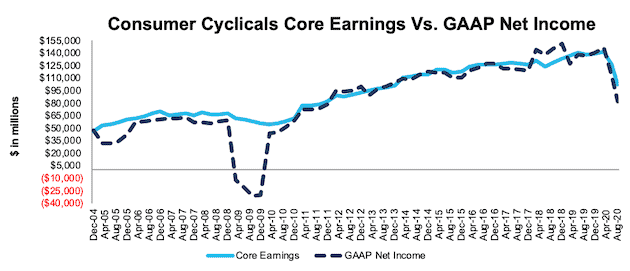
Figure 3 shows that the COVID-19 pandemic impacted the Consumer Cyclicals sector in different ways than during the Financial Crisis, when core earnings were largely unchanged. The global shutdowns and diminished leisure spending caused core earnings to fall 28% since the end of 2019. Despite the turmoil, we highlighted many Consumer Cyclicals stocks that present excellent fundamental risk/reward in our “See Through the Dip” Long Ideas.
Figure 3: Consumer Cyclicals Core Earnings Vs. GAAP: 2004 – 8/11/20
Sources: New Constructs, LLC and company filings.
Our Core Earnings analysis is based on aggregated TTM data for the sector constituents in each measurement period.
Consumer Non-Cyclicals
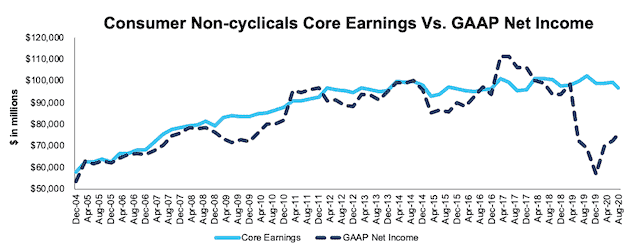
Figure 4 shows core earnings for the Consumer Non-Cyclicals sector have been relatively stable, falling just 2% since 2019. However, investors looking at GAAP net income would see a much different picture. The drastic drop in GAAP net income is a result of Kraft Heinz’s (KHC) ~$16 billion write-down of its Kraft and Oscar Mayer brands. Our core earnings remove such unusual charges so investors get more accurate views of profits.
Figure 4: Consumer Non-Cyclicals Core Earnings Vs. GAAP: 2004 – 8/11/20
Sources: New Constructs, LLC and company filings.
Our Core Earnings analysis is based on aggregated TTM data for the sector constituents in each measurement period.
Energy
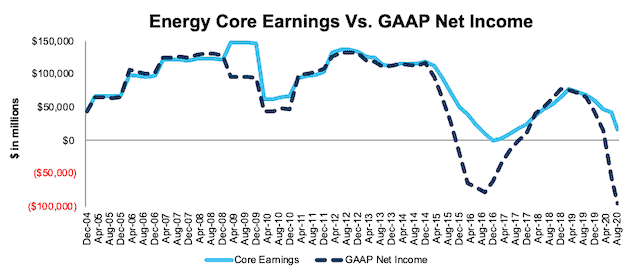
Figure 5 shows core earnings for the Energy sector fell 65% since the end of 2019, and an astonishing 79% since mid-2019. Five companies, Schlumberger (SLB), Occidental Petroleum (OXY), Marathon Petroleum (MPC), Chevron Corporation (CVX), and Baker Hughes (BKR) saw GAAP net income fall by more than $10 billion since the end of 2019. Combined, these firms reported over $44 billion in asset write-downs over the TTM, which is more than double the core earnings of the entire sector. It’s not all bad news, we’ve identified two Energy firms that provide good risk/reward: HollyFrontier (HFC) and Phillips 66 (PSX).
Figure 5: Energy Core Earnings Vs. GAAP: 2004 – 8/11/20
Sources: New Constructs, LLC and company filings.
Our Core Earnings analysis is based on aggregated TTM data for the sector constituents in each measurement period.
Financials
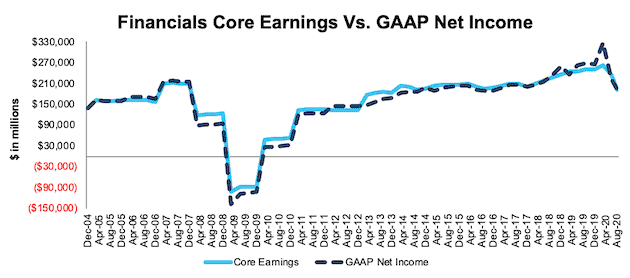
Figure 6 shows core earnings for the Financials sector, while down 27% since the end of 2019, have held up much better than during the Financial Crisis. The key difference between the two periods, as we pointed out in our Long Idea on JPMorgan Chase (JPM), is that many banks were the source of the problems that caused the Financial Crisis. On the other hand, today, Financial firms are playing a key role in the recovery.
Figure 6: Financials Core Earnings Vs. GAAP: 2004 – 8/11/20
Sources: New Constructs, LLC and company filings.
Our Core Earnings analysis is based on aggregated TTM data for the sector constituents in each measurement period.
Healthcare
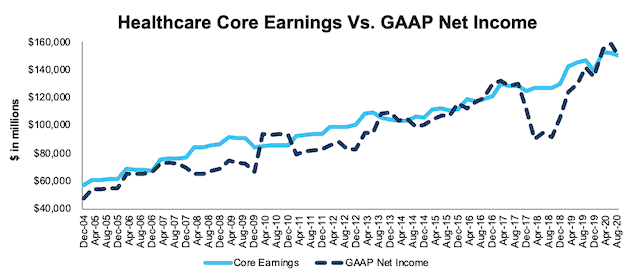
Figure 7 shows core earnings for the Healthcare sector have consistently increased since 2004 and are currently down just 1% since 2019. The consistent increased demand for healthcare from COVID helps drive continued core earnings growth. We recently featured HCA Healthcare (HCA) and Universal Health Services (UHS) as Long Ideas.
Figure 7: Healthcare Core Earnings Vs. GAAP: 2004 – 8/11/20
Sources: New Constructs, LLC and company filings.
Our Core Earnings analysis is based on aggregated TTM data for the sector constituents in each measurement period.
Industrials
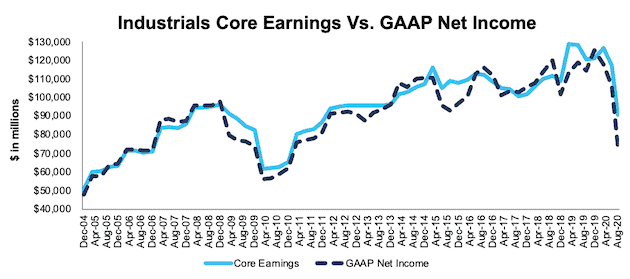
Figure 8 shows the Industrials sector is another sector particularly impacted by COVID-19, as core earnings fell 28% since the end of 2019. Not surprisingly, the Industrials sector bore much of the brunt of the global shut downs.
Figure 8: Industrials Core Earnings Vs. GAAP: 2004 – 8/11/20
Sources: New Constructs, LLC and company filings.
Real Estate
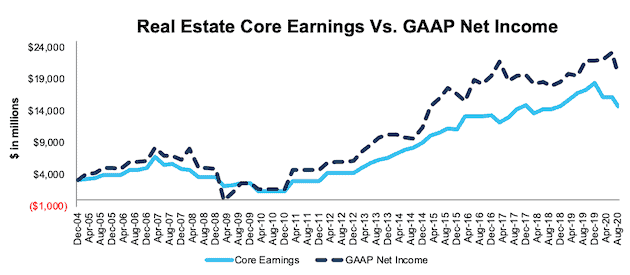
Figure 9 shows that after many years of consistent growth, core earnings for the Real Estate sector have fallen 9% since the end of 2019. Doomsday expectations for many REITs left some of the best operators significantly undervalued, which led us to feature Simon Property Group (SPG) as a Long Idea in mid-April.
Figure 9: Real Estate Core Earnings Vs. GAAP: 2004 – 8/11/20
Sources: New Constructs, LLC and company filings.
Our Core Earnings analysis is based on aggregated TTM data for the sector constituents in each measurement period.
Technology
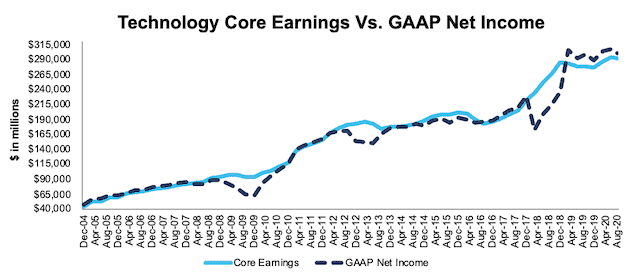
Figure 10 shows that not only did the Technology sector’s core earnings rise since 2019, it generates the most core earnings of any sector. However, this earnings power is not evenly distributed. Over the TTM, the top five companies (as measured by core earnings), Apple (AAPL), Microsoft (MSFT), Alphabet (GOOGL), Facebook (FB), and Intel Corporation (INTC), accounted for 59% of the sector’s total core earnings.
Figure 10: Technology Core Earnings Vs. GAAP: 2004 – 8/11/20
Sources: New Constructs, LLC and company filings.
Our Core Earnings analysis is based on aggregated TTM data for the sector constituents in each measurement period.
Telecom Services
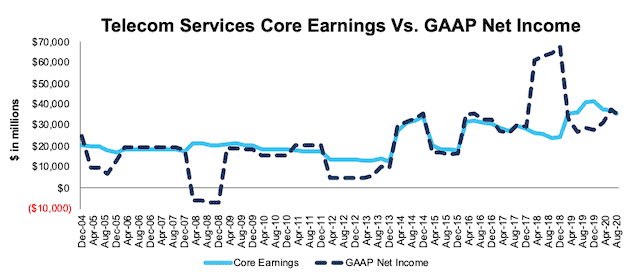
Figure 11 shows core earnings for the Telecom Services sector, despite falling 6% since the end of 2019, are still much improved since the end of 2018. The significant jump in GAAP net income in 2018 highlights the impacts of the Tax Cuts and Jobs Act. At the time, we identified Verizon and AT&T as the biggest winners of tax reform, and in 2017 they recorded nearly $25 billion in combined income tax benefits.
Figure 11: Telecom Services Core Earnings Vs. GAAP: 2004 – 8/11/20
Sources: New Constructs, LLC and company filings.
Our Core Earnings analysis is based on aggregated TTM data for the sector constituents in each measurement period.
Utilities
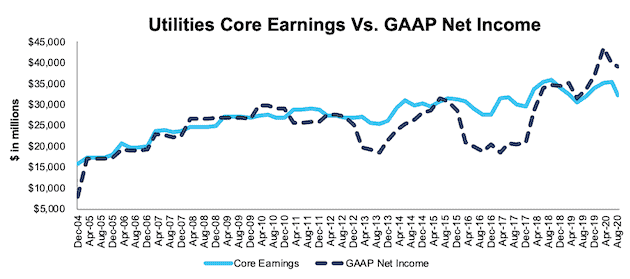
Figure 12 shows the largely consistent nature of the Utilities sector, which seldom sees big year-over-year increases/declines, but rather steady core earnings growth since 2004.
Figure 12: Utilities Core Earnings Vs. GAAP: 2004 – 8/11/20
Sources: New Constructs, LLC and company filings.
Our Core Earnings analysis is based on aggregated TTM data for the sector constituents in each measurement period.
This article originally published on September 4, 2020.
Disclosure: David Trainer, Kyle Guske II, and Matt Shuler receive no compensation to write about any specific stock, style, or theme.
Follow us on Twitter, Facebook, LinkedIn, and StockTwits for real-time alerts on all our research.
[1] For 3rd-party reviews on the benefits of adjusted Core Earnings, historically and prospectively, across all stocks, click here and here.