
COVID-19 has wreaked havoc on economies across the globe and resulted in record asset write-downs. Meanwhile, the S&P 500 races to new all-time highs as most investors are already looking past the COVID-induced decline in earnings, just as we recommended in our See Through the Dip series of Long Ideas.
Now is the time for investors, especially fiduciaries, to reduce risk in equity portfolios.
S&P 500 Pricing In a Major Earnings Recovery – Already
In our last update, The Market Is Right & Consensus Earnings Are Wrong, we called a market bottom in March. We’re calling a market top in this quarter’s review of the S&P 500’s true Core Earnings and valuation. Figure 1 shows how the bottoming out of Core Earnings during the Financial Crisis presaged the market rebound in 2009.
Currently, Figure 1 shows that the market is anticipating a strong rebound in earnings even sooner, relative to the trend in Core Earnings, than during the Financial Crisis. Consequently, with expectations already so high, any setbacks to the recovery will hit the large cap heavy weight stocks driving the S&P 500 hard.
While retail and momentum investors may push markets higher, those with fiduciary duties should consider pumping the brakes and lowering the risk in their portfolios by selling stocks with abnormally high valuations (we provide a list below).
Figure 1: Core Earnings vs. S&P 500 Price: 2004 to Present
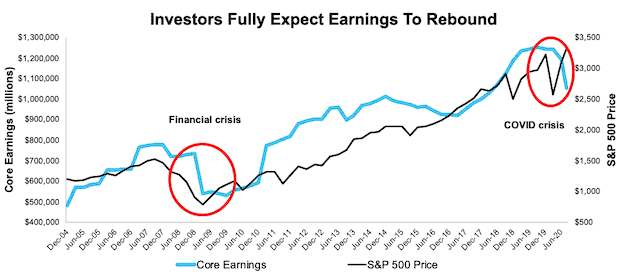
Sources: New Constructs, LLC, company filings, and S&P Global (SPGI).
Our Core Earnings analysis is based on aggregated TTM data for the S&P 500 constituents in each measurement period.
The Right Measure of Earnings Matters – Especially for Fiduciaries
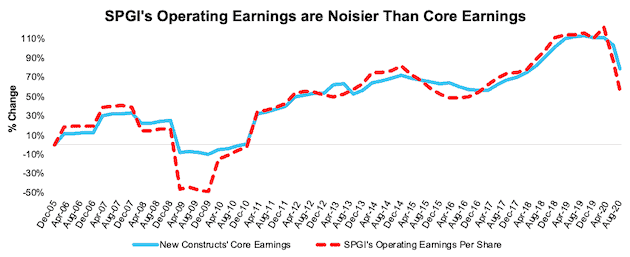
Figure 2 highlights how different our measure of Core Earnings is from S&P Global’s (SPGI) Operating Earnings. The differences are due to SPGI’s data systems not capturing the full impact of unusual gains/losses buried in footnotes as shown by this Harvard Business School & MIT Sloan study. Missing these unusual gains and losses causes earnings to be unreliable and subject to management manipulation.
Relying on this legacy provider’s data can put investors at risk of not understanding the true trajectory of earnings and, consequently, at risk of holding the wrong stocks.
Figure 2: Core Earnings vs. SPGI’s Operating Earnings: 2005 – Present
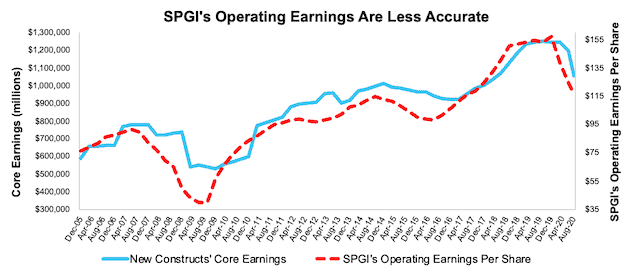
Sources: New Constructs, LLC, company filings, and S&P Global. Note: the most recent periods’ data for SPGI’s Operating Earnings is based on consensus.
Our Core Earnings analysis is based on aggregated TTM data through 9/30/13, and aggregated quarterly data thereafter for the S&P 500 constituents in each measurement period. More details in Appendix I.
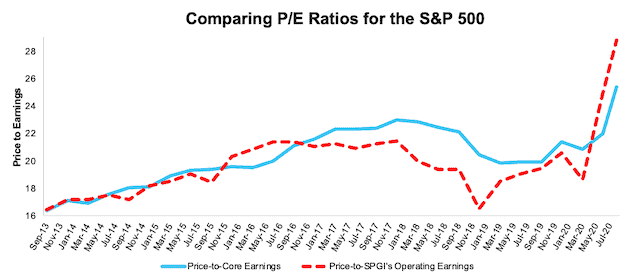
Figure 3 shows how much the P/E ratio based on SPGI’s Operating Earnings differed from the P/E based on our Core Earnings during the Financial Crisis. While our P/E signaled a buy in December 2008, SPGI’s P/E signaled sell. Currently, our P/Es agree that the market is fully valuing a significant recovery in earnings.
As mentioned above, anything that threatens that recovery will hit stocks hard. All the more reason for fiduciaries to be diligent about analyzing earnings accurately at both the market level and for individual stocks.
Figure 3: Price-to-Core vs. Price-to-SPGI’s Operating Earnings: TTM 12/31/04 – Present
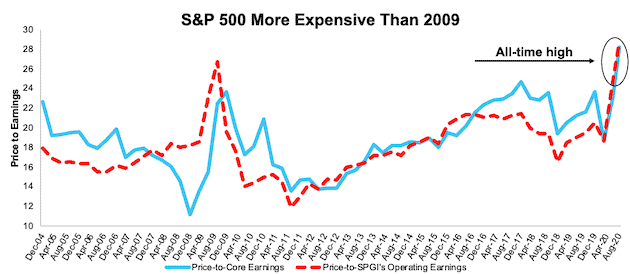
Sources: New Constructs, LLC, company filings, and S&P Global.
Note that the Core Earnings P/E ratio is aggregating the TTM results for constituents in each period. SPGI P/E is based on four quarters of aggregated S&P 500 results in each period. More details in Appendix II.
COVID-19 Erased Years of Earnings, But It’s Not as Bad as You Think
As we showed last quarter, a differentiated view on earnings can lead to a differentiated view on valuation. Our measure of Core Earnings leverages cutting-edge technology to provide clients with a cleaner and more comprehensive view of earnings[1], which shows that earnings, while at multi-year lows, aren’t as bad as Wall Street would have you believe.
Trailing-twelve month (TTM) Core Earnings for the S&P 500 have fallen 15% since the end of 2019 while consensus TTM S&P Global Operating Earnings per share[2] for the S&P 500 have fallen 26%. The COVID-19-induced economic downturn wiped out eight quarters worth of Core Earnings growth in just two quarters.
Figure 4 charts the percentage change in our Core Earnings and SPGI’s operating earnings, and more clearly illustrates that our Core Earnings are less volatile and present a better measure of the normalized performance of businesses. Appendix I provides percentage changes in Core Earnings and SPGI’s Operating Earnings since 2005.
These differences at the aggregate level come from even larger differences at the individual company level. In other words, investors armed with our measure of Core Earnings have a differentiated and more informed view of the fundamentals of companies.
Figure 4: Core vs. SPGI’s Operating Earnings for the S&P 500 – % Change: TTM 12/31/13 – 8/11/20
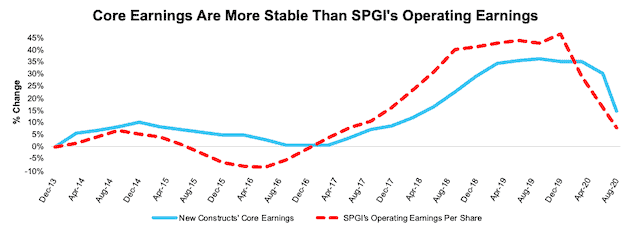
Sources: New Constructs, LLC, company filings, and S&P Global (SPGI).
Note: the most recent periods’ data for SPGI’s Operating Earnings is based on consensus.
Our Core Earnings analysis is based on aggregated quarterly data for the S&P 500 constituents in each measurement period.
Lower Risk – Sell the Riskiest Stocks
Below are some of the stocks that we think present abnormally high risk. Selling these stocks would provide most investors with more than healthy gains. Nevertheless, this strategy is directed more to fiduciaries than traders, who see the recent price performance as reason for holding these positions. Fiduciaries need more than price momentum to justify investing in a given stock.
- Wayfair (W) – This Online Retailer is Furnishing Investors With Risk
- Tesla (TSLA) – Tesla: The Most Dangerous Stock for Fiduciaries
- Uber (UBER) – The Emperor Has No Clothes – Uber’s Business Model Is Broken
- Carvana (CVNA) – You Won’t Find a Bargain With This Car Dealer
- Beyond Meat (BYND) – Competition Will Eat This Firm Alive
Stocks to Own Instead
Since mid-April, we’ve identified several companies with strong underlying Core Earnings and valuations implying profits would never recover from COVID-induced lows. These stocks have not seen huge increases in their prices even though their cash flows are far superior to the companies above.
Our “See Through the Dip” thesis acknowledges that most of these firms’ profits are on the decline in the short term, however, their fundamentals, along with ample liquidity, will enable them not just to survive the economic downturn, but also thrive in a recovery. These stocks should be held through the market turmoil as we expect them to outperform the crowded passive strategies over the long term.
Figure 5: See Through the Dip Stocks Vs. S&P 500 – Prices through September 2, 2020
Sources: New Constructs, LLC and company filings.
This article originally published on September 3, 2020.
Disclosure: David Trainer owns SYY, DHI, H, JPM, SPG, and LUV. David Trainer, Kyle Guske II, and Matt Shuler receive no compensation to write about any specific stock, style, or theme.
Follow us on Twitter, Facebook, LinkedIn, and StockTwits for real-time alerts on all our research.
Appendix I: Core Earnings Methodology & Historical Analysis
Figure I shows the percentage change in Core Earnings and S&P Operating Earnings per share dating back to 2005. Note the severity of the decline brought on by the COVID-19 pandemic. Core Earnings have declined 15% since March 2020, which is around the time the U.S. economy entered a recession. For reference, during the Great Recession, Core Earnings bottomed in December 2009, which was two years after the U.S. economy entered the recession, and fell 32% during that time.
Note: In Figure 2 above and I below, for analysis post 9/30/13, we use aggregated quarterly data for the companies in the S&P 500. For values prior to 9/30/13, we use aggregated annual data for every company in the S&P 500. While we prefer aggregated quarterly numbers, we have examined the potential impacts of the two methodologies and have found no material differences.
Figure I: Core vs. SPGI’s Operating Earnings for the S&P 500 – % Change: 12/30/05 – 8/11/20
Sources: New Constructs, LLC, company filings, and S&P Global (SPGI).
Note: the most recent periods’ data for SPGI’s Operating Earnings is based on consensus.
Appendix II: P/E Ratio Methodology for Core & SPGI’s Operating Earnings
In Figure 3 above, we calculate the price-to-Core Earnings ratio as follows:
- Calculate a TTM earnings yield for every S&P 500 constituent
- Weight the earnings yields by each stock’s respective S&P 500 weight
- Sum the weighted earnings yields and take the inverse (1/Earnings Yield)
We use the earnings yield methodology because P/E ratios don’t follow a linear trend. A P/E ratio of 1 is “better” than a P/E ratio of 30, but a P/E ratio of 30 is “better” than a P/E ratio of -15. In other words, aggregating P/E ratios can result in a low multiple due the inclusion of just a few stocks with negative P/Es.
Using earnings yields solves this problem because a high earnings yield is always “better” than a low earnings yield. There is no conceptual difference when flipping from positive to negative earnings yields as there is with traditional P/E ratios.
For all periods in Figure 3, we calculate the price-to-SPGI’s Operating Earnings ratio by summing the preceding 4 quarters of Operating Earnings per share and, then, dividing by the S&P 500 price at the end of each measurement period.
Figures II and III show the price-to-Core Earnings ratio using quarterly data for the companies in the S&P 500 (which we have back to December 2012).
In these Figures, we calculate the price-to-Core Earnings ratio as follows:
- Calculate a trailing four quarters earnings yield for every S&P 500 constituent
- Weight the earnings yield by each stock’s respective S&P 500 weight
- Sum the weighted earnings yields and take the inverse (1/Earnings Yield)
This method allows us to capture the impact of changes to S&P 500 constituents on a quarterly basis. For example, a company could be a constituent in 2Q18, but not in 3Q18. This method captures the continuously changing nature of the S&P 500 constituency.
Through this analysis, we see that the market trades at the highest P/E since at least 2013 based on our Core Earnings, but well below the P/E based on SPGI’s Operating Earnings.
Figure II: Price-to-Core vs. Price-to-SPGI’s Operating Earnings: Quarterly 9/30/13 – Present
Sources: New Constructs, LLC, company filings, and S&P Global.
P/E ratios are based on four quarters of aggregated S&P 500 constituent results in each period.
Figure III shows that our price-to-Core Earnings ratio provides a much more normalized measure of the S&P 500’s valuation, compared to the price-to-SPGI’s Operating Earnings ratio, which jumped significantly since March 2020 as Operating Earnings have plummeted (per Figure 2 above).
Figure III: Price-to-Core vs. Price-to-SPGI’s Operating Earnings: Quarterly 10 Quarter Average
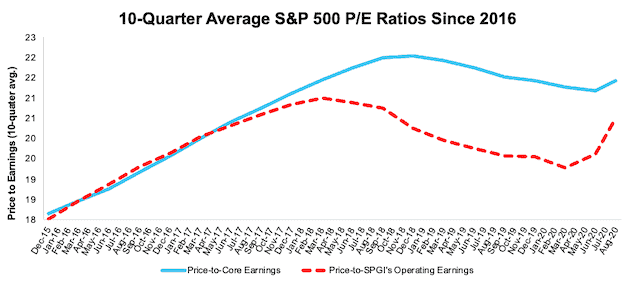
Sources: New Constructs, LLC, company filings, and S&P Global.
P/E ratios are based on four quarters of aggregated S&P 500 constituent results in each period.
[1] For 3rd-party reviews on the benefits of adjusted Core Earnings, historically and prospectively, across all stocks, click here and here.
[2] We think SPGI’s Operating Earnings provide the best comparison to how we calculate Core Earnings.