Editor’s Note: Since we published this report, the company changed its name and ticker to HF Sinclair Corporation (DINO).
We published an update on this Long Idea on March 2, 2022. A copy of the associated Earnings Update report is here.
This best-in-class refiner has experienced major disruption to its operations as demand for gasoline, diesel, and jet fuel have all recently plummeted. However, investors who look past this temporary decline can find great value long term. HollyFrontier (HFC: $27/share) is this week’s Long Idea.
HollyFrontier’s “Dip” in Profits
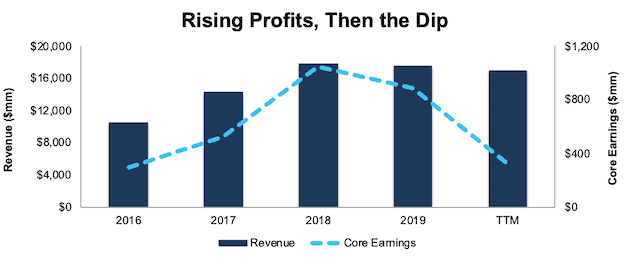
From 2016 to 2019, HollyFrontier grew revenue by 18% compounded annually and core earnings[1] by 44% compounded annually, per Figure 1. The firm increased its core earnings margin from 2.8% to 5.1% over the same time.
As expected, trailing-twelve-month (TTM) core earnings have declined significantly as the COVID-19 pandemic has shuttered economies across the globe. We expect core earnings and other profitability metrics may get worse before they get better. Our thesis does not depend on profit growth, as we’ll explain in the valuation section of this report.
Figure 1: Core Earnings & Revenue Growth Were Rising Before the Pandemic
Sources: New Constructs, LLC and company filings.
The current downward profit trend is temporary, not permanent, and masks HollyFrontier’s long-term ability to generate significant free cash flow (FCF). The company generated positive FCF in seven of the past 10 years and a cumulative $1.1 billion (26% of market cap) in FCF over the past five years. HollyFrontier’s $831 million in free cash flow over the TTM period equates to a 10% FCF yield, which is higher than the Energy sector average of 7%.
Executive Compensation Properly Incentivizes Management
No matter the macro environment, investors should look for companies with executive compensation plans that directly align executives’ interests with shareholders’ interests. Quality corporate governance holds executives accountable to shareholders by incentivizing them to allocate capital prudently.
HollyFrontier ties executives’ annual incentive cash compensation to the financial, operational, and strategic goals of the firm. One of the financial goals used to determine annual cash compensation is return on capital employed (ROCE), which is similar to ROIC.
In addition, half of HollyFrontier’s long-term incentive plan rewards executives with performance share units (PSUs) tied to a ROCE target relative to its incentive peer group. The other half of long-term incentive PSUs are tied to total shareholder return.
There are some flaws in HollyFrontier’s ROCE calculation that make it less impactful than it could be. Most importantly, HollyFrontier’s capital employed calculation omits important elements of invested capital such as goodwill and intangible assets, which means management is not held fully accountable for all the capital invested into the business.
Despite its flaws, the inclusion of ROCE means that HollyFrontier’s executive compensation plan is better aligned with creating shareholder value than many other companies. We would prefer the firm use ROIC improvement when determining executive compensation, as there is a strong correlation between improving ROIC and increasing shareholder value. Having accurate values for NOPAT and invested capital ensures investors have an apples-to-apples metric for measuring corporate performance and holds management accountable for every dollar invested into the company.
Despite not using ROIC when measuring performance, HollyFrontier’s compensation plan has not compensated executives while destroying shareholder value. HollyFrontier has grown economic earnings by 10% compounded annually over the past decade.
Ample Liquidity to Survive the Downturn
While the COVID-19 pandemic has disrupted HollyFrontier’s operations in the short term, the firm’s available liquidity positions it to weather the downturn. The firm’s cash balance on April 8, 2020 was $900 million. When combined with an additional $1.4 billion in an undrawn credit facility, HollyFrontier has nearly $2.3 billion of available liquidity.
To illustrate the firm’s strong cash position, we review a worst-case scenario, where HollyFrontier generates no revenue and the firm maintains 1Q20-level SG&A expenses ($29 million per month) and interest expense ($8 million per month). In addition to these expenses, we also assume the firm maintains its capex spending consistent with a target of $625 million in 2020 (including $83.7 million in 1Q20), which equates to expected monthly capital expenditure of ~$60 million. In such a scenario, the firm could operate for over 23 months with its available liquidity before needing additional capital.
It’s highly unlikely that HollyFrontier’s revenue would go to zero. The firm noted in April that its refining segment was running at approximately 70% capacity. Furthermore, while the demand for gasoline, diesel fuel, and even jet fuel is depressed, it is not expected to go to zero, as cars, trucks, and planes are still operating.
Improving Profitability Helps Grow Market Share During the Crisis and in the Recovery
COVID-driven disruptions to the energy industry have already driven financially weaker operators out of business. HollyFrontier’s profitability was growing at a faster rate than its competitors before the crisis, and the firm is well-positioned to return to profit growth when the economy recovers.
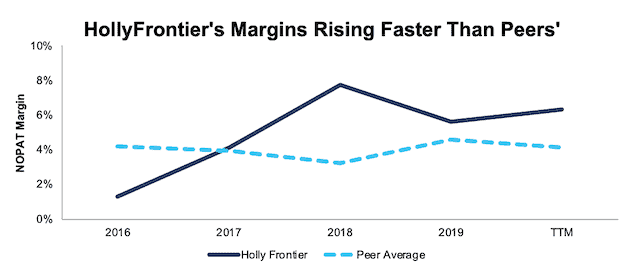
Per Figure 2, HollyFrontier’s net operating profit after-tax (NOPAT) margin has improved from 1% in 2016 to 6% TTM. Over the same time, the market-cap-weighted average of HollyFrontier’s peer group has remained at 4%. This peer group consists of six other independent refiners including Phillips 66 (PSX), Marathon Petroleum Corp (MPC), Valero Energy Corp (VLO), CVR Energy (CVI), Delek U.S. Holdings, Inc. (DK), and PBF Energy Inc. (PBF).
Figure 2: NOPAT Margin vs. Peers
Sources: New Constructs, LLC and company filings.
HollyFrontier’s invested capital turns, a measure of balance sheet efficiency, have improved from 1.2 in 2016 to 1.5 TTM, per Figure 3. The peer group’s market-cap-weighted average invested capital turns have increased at a slower rate from 1.7 to 1.8 over the same time.
Figure 3: Invested Capital Turns vs. Peers

Sources: New Constructs, LLC and company filings.
HollyFrontier’s rising margins and improving invested capital turns help drive the firm’s rising return on invested capital (ROIC). Per Figure 4, HollyFrontier’s ROIC improved from 1.6% in 2016 to 9.5% TTM while the market-cap- weighted average of peers’ ROIC slightly improved from 7.0% to 7.1% over the same time.
Figure 4: ROIC vs. Peers

Sources: New Constructs, LLC and company filings.
Unless you believe that there will be no need for petroleum products in a post-COVID-19 world, it’s hard to argue against HollyFrontier’s ability to survive. And, if it survives, it’s hard to argue against the firm’s superior profitability before the crisis translating into profits in a recovery.
This Middleman Makes Money from High or Low Oil Prices
Lower oil prices are typically bad news for most energy firms engaged in exploration and production, but that is not the case with independent refiners who operate as middlemen converting crude oil into usable products. Simply put, refineries take crude oil and sell products derived from that oil for a higher price than the cost of the oil. The difference between the refined product price and crude oil price is known as the crack spread. The greater the crack spread, the more profitable the refinery. So, while many oil producers will see lower profits or even losses in a low-oil-price environment, refiners profit by maintaining adequate crack spreads.
HollyFrontier’s geographic position helps boost its crack spread by controlling costs and commanding premium pricing. All of HollyFrontier’s refineries are situated near low-cost oil supplies. The firm’s locational advantage gives it access to low-cost Permian Basin and Western Canadian oil to which many other refiners located across the U.S. do not have access.
The firm also owns five complex refineries. Complex refineries are capable of refining products that sell for higher premiums such as HollyFrontier’s lucrative lubricants and specialty products. The combination of low-cost oil and high-priced products helps the firm achieve superior margins to its peers.
While short-term demand has been impacted by COVID-19-related disruptions, we believe a recovery is likely over the long term since the International Monetary Fund (IMF) and nearly every economist in the world believe the global economy will grow strongly in 2021. The IMF estimates the global economy will expand by 5.4%, and the U.S. economy by 4.5%, in 2021. Fitch Ratings projects global GDP growth of 5.1% in 2021, and for “pre-virus levels of GDP” to be reached in mid-2022 in the US and later in Europe. The overall growth in the economy should lead to a rebound in consumer activity, which will drive demand for refined oil products. Furthermore, lower oil prices could help HollyFrontier’s profits recover as depressed oil prices increase demand for petroleum-based products relative to higher-priced alternatives.
Product Mix Should Provide Quicker Rebound
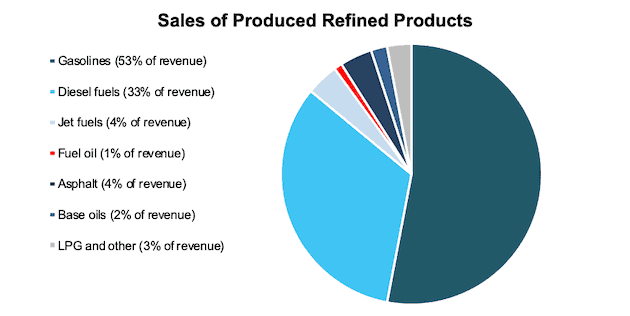
Much has been made of the decline in travel due to the impact of COVID-19, with air travel perhaps being impacted the most as YoY passengers decreased by as much as 96% in April. Such a steep decline in passengers not only affects the airline industry, but also refiners who supply the industry with jet fuels. At the end of 1Q20, HollyFrontier had little exposure to the decline in air travel demand as the firm generated only 4% of its refined products’ revenue from jet fuels. Figure 5 shows the sales mix of HollyFrontier’s refined products.
Figure 5: Transportation Fuels Account for 90% of Refined Products’ Sales as of 1Q20
Sources: New Constructs, LLC and company filings.
The decrease in car traffic across the nation during the peak of the lockdowns was noticeable. However, traffic levels have now rebounded to ~90% of pre-COVID-19 levels. As expected, gasoline consumption is rebounding as well. In early June, petroleum products supplied to the domestic market reached 17.6 million barrels per day, which was up from the low of just 13.8 million barrels per day in April. With 86% of its 2019 revenue from gasoline and diesel fuels, HollyFrontier should see a quicker rebound than refiners more heavily tied to jet fuels.
Furthermore, as we pointed out in our Long Idea on Standard Motor Products (SMP), the number of vehicles and miles driven is steadily rising, and projected to rise in the future, thereby providing a future runway for growth at HollyFrontier.
EV Slows Down Growth, but Not as Much as You May Think
There is no doubt that electric vehicles (EVs) and improved efficiency standards will affect future demand for fossil fuels as the IEA expects a decline in U.S. gasoline demand over the 2020-2025 period. While EVs certainly impact growth, the fear of an immediate EV takeover of the automobile industry is overstated. As of March 2019, 1.8% of all vehicles in the U.S. were EVs while EV sales as a fraction of all new car sales were just 1.5% in 1Q19. Even as EV continues to grow, the Edison Electric Institute expects EVs will be just ~7% of all vehicles on U.S. roads in 2030.
The EIA’s expected decline in U.S. gasoline demand does not mean that it also expects a decline in U.S. refining operations. Rather, the EIA’s reference case for U.S. refineries shows that U.S. refineries will remain competitive even as domestic demand declines. In this scenario, U.S. refineries are likely to keep similar utilization rates (gross input to the refinery / operating capacity of the refinery) to recent levels of 90% to 93%. This scenario expects net exports of U.S. liquid fuels to peak at more than 3.8 million barrels per day (b/d) in the early 2030s.
Underpinning the expected growth in U.S. exports of refined products is the International Maritime Organization’s regulations starting in 2020 to reduce sulfur in bunker oil that ships use. Many international refineries lack the capability to process fuel that meets the new requirements. HollyFrontier, however, with its complex refineries, is positioned to profit from increased demand for lower sulfur fuel.
Additionally, similar export opportunities are likely to arise as global oil demand is expected to grow through at least 2030.
Fuel for the Future
While the threat from electric vehicles and other alternative fuels may be far off, it is real, and HollyFrontier is positioning itself for such a future through its investment in renewable diesel. Renewable diesel can be derived from vegetable oils and animal fats and has the added benefit over biodiesel in being chemically identical to petroleum diesel.
The chemical nature of renewable diesel means it can be used in engines designed to run on petroleum diesel. This allows owners of diesel vehicles and fleets to switch fuels at no additional cost. The firm expects to produce over 200 million gallons per year of renewable diesel with its planned conversion of the Cheyenne Refinery and construction of a renewable diesel unit at its Artesia Refinery. For reference, there are currently five plants in the U.S. that produce renewable diesel with a combined capacity of 400 million gallons per year, but an Emerging Markets Online study estimates global renewable diesel production capacity will increase by 14% compounded annually from 2019 to 2030.
Renewable diesel is more than just a revenue growth opportunity for HollyFrontier. It will also help reduce costs for the firm. Refineries are required by the EPA to either blend biofuels with refined products or purchase Renewable Identification Numbers (RINs) in lieu of blending. These requirements can be especially adverse to independent refiners when crack spreads tighten as was the case for the firm in 2016 when YoY NOPAT declined by 87%. Last year, RIN costs for the firm were $111 million (11% of 2019 NOPAT).
The added renewable diesel unit at HollyFrontier’s Artesia Refinery will allow the firm to meet the EPA’s blending requirements for all of the firm’s refineries under current market conditions. In other words, the Artesia Refinery will eliminate HollyFrontier’s need to purchase RINs, and enable it to sell excess RINs to other refineries instead.
HFC Is Undervalued
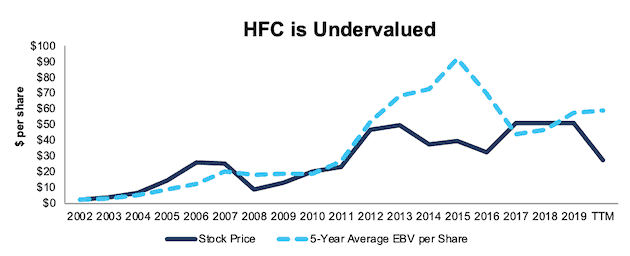
After falling 46% year-to-date (YTD) to $27/share, HFC now trades significantly below its economic book value, or no-growth value, and at its cheapest price-to-economic book value (PEBV) ratio (0.3) since 2011, the year of the merger between Holly Corporation and Frontier Oil Corporation. This ratio means the market expects HollyFrontier’s NOPAT to permanently decline by 70%. This expectation seems overly pessimistic over the long term. For reference, HollyFrontier grew NOPAT by 16% compounded annually over the past decade.
HollyFrontier’s current economic book value is $102/share – a 278% upside. Per Figure 6, Holly Frontier’s five-year average EBV per share, which helps smooth out the volatility in the Energy industry, is $59/share, more than double the current stock price.
Figure 6: Stock Price vs. Five-Year Economic Book Value (EBV) per Share
Sources: New Constructs, LLC and company filings.
HFC’s Current Price Implies No Economic Recovery
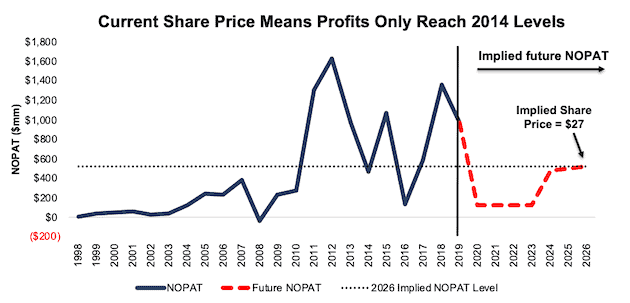
HollyFrontier is priced as if the COVID-driven economic decline will permanently depress its profits. Below, we use our reverse DCF model to quantify the cash flow expectations baked into HollyFrontier’s current stock price. Then, we analyze the implied value of the stock based on different assumptions about COVID-19’s impact on the economy and HollyFrontier’s future growth in cash flows.
Scenario 1: Using historical revenue declines, historical margins, and average historical GDP growth rates, we can model the worst-case scenario already implied by HollyFrontier’s current stock price. In this scenario, we assume:
- NOPAT margins fall to 1.3% (lowest since the 2011 merger, compared to 6% TTM) in 2020-2023 and increase to 5% (all-time average) in 2024 and each year thereafter
- Revenue falls 46% (more than double IBIS World’s estimated Petroleum Refining industry decline of 22.4% in 2020) in 2020 and does not grow from 2021 to 2023 (vs. 2021 consensus +40%)
- Sales begin growing again in 2024, but only at 3.5% a year, which is the average global GDP growth rate since 1961
In this scenario, where HollyFrontier’s NOPAT declines 9% compounded annually over the next seven years (including an 88% YoY drop in 2020), the stock is worth $27/share today – equal to the current stock price. See the math behind this reverse DCF scenario.
For reference, when HollyFrontier faced challenging commodity prices and high RIN costs ($242 million) in 2016, the firm’s NOPAT fell 87% YoY before growing 211% compounded annually over the following two years.
Figure 7 compares the firm’s implied future NOPAT in this scenario to its historical NOPAT. This worst-case scenario implies HollyFrontier’s NOPAT seven years from now will be 47% below its 2019 NOPAT. In other words, this scenario implies that a decade after the COVID-19 pandemic, HollyFrontier’s profits will have only recovered to just 9% above 2014 NOPAT levels. HollyFrontier also surpassed this profit level in 2011, 2012, 2013, 2015, 2017, 2018, and 2019. In any scenario better than this one, HFC holds significant upside potential, as we’ll show below.
Figure 7: Current Valuation Implies Severe, Long-Term Decline in Profits: Scenario 1
Sources: New Constructs, LLC and company filings.
Scenario 2: Long-term View Could Be Very Profitable
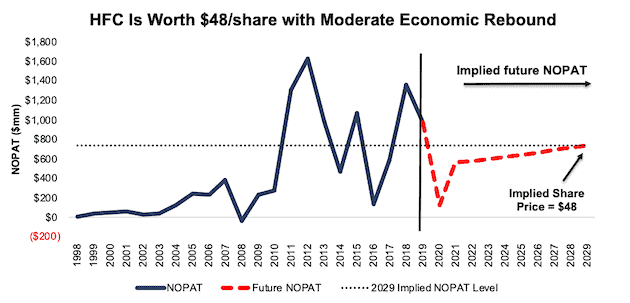
If we assume, as does the International Monetary Fund (IMF) and nearly every economist in the world, that the global economy rebounds and returns to growth starting in 2021, HFC is undervalued.
In this scenario, we assume:
- NOPAT margins fall to 1.3% (low since the 2011 merger, compared to 6% TTM) in 2020 and increase to 5% (all-time average) in 2021 and each year thereafter
- Revenue falls 46% (more than double IBIS World’s estimated Petroleum Refining industry decline of 22.4% in 2020) in 2020
- Revenue grows again in 2021 at 20% (half of 2021 consensus +40%), and at 3.5% each year thereafter which is the average global GDP growth rate since 1961
In this scenario, HollyFrontier’s NOPAT falls by 3% compounded annually over the next decade (including an 88% YoY drop in 2020) and the stock is worth $48/share today – a 71% upside to the current price. See the math behind this reverse DCF scenario.
For comparison, HollyFrontier has grown NOPAT by 91% compounded annually over the past three years and 16% compounded annually over the past five years. It’s not often investors get the opportunity to buy a growing company at such a discounted price.
Figure 8 compares the firm’s implied future NOPAT in scenario 2 to its historical NOPAT. This scenario implies that a decade from now, HollyFrontier’s NOPAT will be 24% below NOPAT in both 2019 and 2013. If profits return to these levels in less than 10 years, HFC has even more upside potential.
Figure 8: Implied Profits Assuming Moderate Recovery: Scenario 2
Sources: New Constructs, LLC and company filings.
Sustainable Competitive Advantages Will Drive Shareholder Value Creation
Here’s a summary of why we think the moat around HollyFrontier’s business will enable it to continue to generate higher NOPAT than the current market valuation implies. The following competitive advantages help HollyFrontier survive the downturn and return to growth as the economy rebounds:
- Strong balance sheet to survive the economic dip
- Access to lower-priced oil
- Higher profitability than peers
What Noise Traders Miss with HollyFrontier
These days, fewer investors focus on finding quality capital allocators with shareholder friendly corporate governance. Instead, due to the proliferation of noise traders, the focus is on short-term technical trading trends while high-quality fundamental research is overlooked. Here’s a quick summary of what noise traders are missing:
- Recent core earnings growth before the pandemic
- HollyFrontier’s investment in the future with renewable diesel
- Valuation implies refining industry never recovers
5% Yield Supported by Cash Flow
The firm has increased its dividend six times over the past decade. From 2015 to 2019, the firm generated more in in free cash flow ($1.1 billion) than it paid out in dividends ($849 million), or an average $55 million surplus each year. Over the TTM, the firm has generated $831 million in FCF while paying out $133 million in dividends. Its last quarterly dividend, when annualized, equals $1.40/share and provides a 5.2% yield.
Firms with cash flows greater than dividend payments have a higher likelihood to maintain and grow dividends.
Historically, HollyFrontier has also returned capital to its shareholders through share repurchases. However, the firm stated in its 1Q20 conference call that it does not intend to repurchase any shares, “until market conditions and visibility improve.” Before suspending repurchases, HollyFrontier repurchased $1.8 billion (41% of current market cap) over the past five years. A return to repurchasing shares once the economy stabilizes, or even returns to growth, would provide additional yield for investors.
A Consensus Beat or Signs of Recovery Could Send Shares Higher
According to Zacks, consensus estimates at the end of January pegged HollyFrontier’s 2020 EPS at $4.71/share. Jump forward to July 6, and consensus estimates for HollyFrontier’s 2020 EPS have fallen to $-0.37/share. 2021 estimates follow a similar trend. At the end of January, 2021 EPS consensus was $4.43/share and has since fallen to $1.49/share.
Though the COVID-19 pandemic has reduced demand for petroleum products, these lowered expectations provide a great opportunity for a strong company, such as HollyFrontier, to beat consensus. Our current Earnings Distortion Score, which is a short-term indicator of the likelihood to beat or miss expectations, for HollyFrontier is “Beat.” The lowered expectations moving forward make it much easier for the firm to beat earnings.
The firm beat EPS estimates in nine of the past 12 quarters, and doing so again, in the midst of such market turmoil, could send shares higher.
Insider Trading and Short Interest Trends
Over the past twelve months, insiders have bought a total of 745 thousand shares and sold 266 thousand shares for a net effect of 479 thousand shares purchased. These purchases represent less than 1% of shares outstanding.
There are currently 6.3 million shares sold short, which equates to 4% of shares outstanding and under three days to cover. Short interest is down 6% from the prior month. The low and decreasing short interest shows that not many people are willing to bet against this firm.
Critical Details Found in Financial Filings by Our Robo-Analyst Technology
As investors focus more on fundamental research, research automation technology is needed to analyze all the critical financial details in financial filings as shown in the Harvard Business School and MIT Sloan paper, "Core Earnings: New Data and Evidence”.
Below are specifics on the adjustments we make based on Robo-Analyst findings in HollyFrontier’s 2019 10-K:
Income Statement: we made $705 million of adjustments, with a net effect of removing $207 million in non-operating expenses (1% of revenue). You can see all the adjustments made to HollyFrontier’s income statement here.
Balance Sheet: we made $1.1 billion of adjustments to calculate invested capital with a net increase of $884 million. One of the largest adjustments was $626 million in asset write-downs. This adjustment represented 6% of reported net assets. You can see all the adjustments made to HollyFrontier’s balance sheet here.
Valuation: we made $4.5 billion of adjustments with a net effect of decreasing shareholder value by $4.4 billion. Apart from total debt, the most notable adjustment to shareholder value was $724 million in net deferred tax liabilities. This adjustment represents 16% of HollyFrontier’s market cap. See all adjustments to HollyFrontier’s valuation here.
Attractive Funds That Hold HFC
The following funds receive our Attractive-or-better rating and allocate significantly to HFC:
- Stock Dividend Fund, Inc. (SDIVX) – 2.4% allocation and Very Attractive rating
- Monteagle Select Value Fund (MVEIX) – 2.1% allocation and Attractive rating
This article originally published on July 8, 2020.
Disclosure: David Trainer, Kyle Guske II, and Matt Shuler receive no compensation to write about any specific stock, style, or theme.
Follow us on Twitter, Facebook, LinkedIn, and StockTwits for real-time alerts on all our research.
[1] Our core earnings are a superior measure of profits, as demonstrated in Core Earnings: New Data & Evidence a paper by professors at Harvard Business School (HBS) & MIT Sloan. The paper empirically shows that our data is superior to “Operating Income After Depreciation” and “Income Before Special Items” from Compustat, owned by S&P Global (SPGI).
