We published an update on PSX on February 16, 2022. A copy of the associated Earnings Update report is here.
After seeing the S&P 500 rise 44% from its March lows, investors should book gains from recent winners and redeploy them in stocks that did not participate in the melt-up. This operator, which processes, transports, stores, and markets petroleum products, fits the bill. Phillips 66 (PSX: $64/share) is this week’s Long Idea.
Profits Were Rising Before the Dip
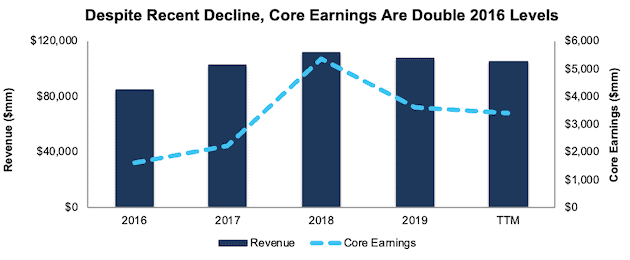
From 2016 to 2019, Phillips 66 grew revenue by 8% compounded annually and core earnings[1] by 31% compounded annually, per Figure 1. The firm increased its core earnings margin from 1.9% to 3.2% over the same time.
As expected, trailing-twelve-month (TTM) core earnings declined as the COVID-19 pandemic shuttered economies across the globe. We expect core earnings may get worse before they get better. However, our thesis does not depend on profit growth, as we’ll explain in the valuation section of this report.
Figure 1: Core Earnings & Revenue Growth Since 2016
Sources: New Constructs, LLC and company filings.
The current downward profit trend is temporary, not permanent, and masks Phillips 66’s long-term ability to generate significant free cash flow (FCF). The company generated positive FCF in each of the past 8 years and $10.7 billion (38% of market cap) in FCF over the past five years. Phillips 66’s $3.1 billion in free cash flow over the TTM period equates to a 6% FCF yield.
Executive and Shareholder Interests Are Aligned
Investors should never assume that a company’s management has shareholders’ interests in mind. Quality corporate governance holds executives accountable to shareholders by incentivizing prudent capital allocation. By evaluating executive compensation plans, investors can find companies, such as Phillips 66, that directly align executives’ interests with shareholders’ interests.
Phillips 66’s long-term incentive programs, in addition to awarding executives with stock options and restricted stock units (RSUs), include a Performance Share Program (PSP). 25% of the PSP is tied to the firm’s absolute Return on Capital Employed (ROCE), and 25% is tied to relative ROCE performance to peers. ROCE is similar to our calculation of return on invested capital (ROIC). The other half of the PSP is tied to total shareholder return.
The executive compensation program also awards annual incentives based on Adjusted EBITDA, safety, environmental, and asset availability goals, Adjusted Controllable Costs, and the effectiveness of the firm’s talent management programs.
In total, ~20% of all executive compensation is tied to ROCE. There is a strong correlation between improving ROIC and increasing shareholder value and Phillips 66’s inclusion of a similar metric (ROCE) places its executive compensation plan above many others in the market that fail to properly align executives’ interests. Phillips 66’s focus on prudent capital allocation helped the firm grow economic earnings from -$97 million in 2015 to $2.1 billion in 2019.
Ample Liquidity to Survive the Downturn
While the COVID-19 pandemic has disrupted Phillips 66’s operations in the short term, the firm’s available liquidity positions it to weather the downturn. The firm’s cash balance on March 31 was $1.2 billion with ~$5.7 billion of revolving credit facilities. In April, the firm paid down $525 million of maturing debt, issued $1 billion of senior notes, and secured $1 billion of incremental term-loan capacity, which is undrawn. Combined, Phillips 66 has nearly $8.4 billion of available liquidity.
To illustrate the firm’s strong cash position, we review a worst-case scenario, where Phillips 66 generates no revenue and the firm maintains 1Q20-level SG&A expenses ($106 million per month) and interest expense ($37 million per month). In addition to these expenses, we also assume the firm maintains capex spending consistent with a target of $3.1 billion in 2020 (including $900 million in 1Q20), which equates to monthly capex of ~$244 million. With total monthly costs of ~$388 million, Phillips 66 has enough liquidity to operate for 21+ months before needing additional capital.
However, it’s highly unlikely that Phillips 66’s revenue would go to zero for any meaningful amount of time, if ever, given the diversity of its revenue streams and the fact that the energy industry is deemed critical infrastructure by the Department of Homeland Security’s Cybersecurity and Infrastructure Security Agency. The firm noted in April that all of its refineries, midstream assets, and lubricants remained operational. Furthermore, while the demand for gasoline, diesel fuel, and even jet fuel is depressed in the short to midterm, it will not go to zero, as cars, trucks, and planes are still operating.
Superior Profitability Helps Grow Market Share During the Crisis and in the Recovery
COVID-driven disruptions to the energy industry have already driven financially weaker operators out of business. Phillips 66’s profitability was superior to its competitors before the crisis, and the firm is well-positioned to return to profit growth when the economy recovers.
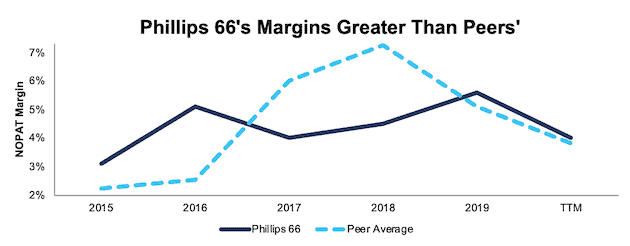
Per Figure 2, Phillips 66’s net operating profit after-tax (NOPAT) margin improved from 3% in 2015 to 4% TTM. Over the same time, the market-cap-weighted average of Phillips 66’s peer group improved from 2% to 4%. This peer group consists of 17 integrated oil companies, marketers, and independent refiners including Exxon Mobil Corp (XOM), Chevron Corporation (CVX), BP, PLC (BP), Suncor Energy Inc (SU), Marathon Petroleum Corp (MPC), and Valero Energy Corp (VLO) among others[2].
Figure 2: NOPAT Margin vs. Peers
Sources: New Constructs, LLC and company filings.
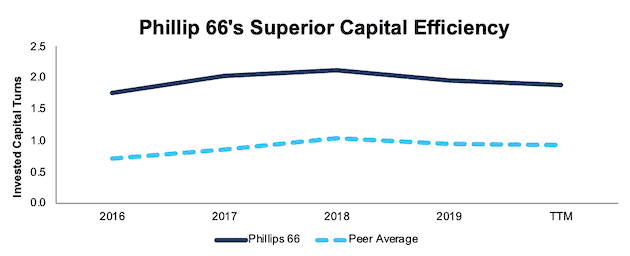
Phillips 66’s invested capital turns, a measure of balance sheet efficiency, improved from 1.8 in 2016 to 1.9 TTM, per Figure 3. The peer group’s market-cap-weighted average invested capital turns are much lower and increased from 0.7 to 0.9 over the same time.
Figure 3: Invested Capital Turns vs. Peers
Sources: New Constructs, LLC and company filings.
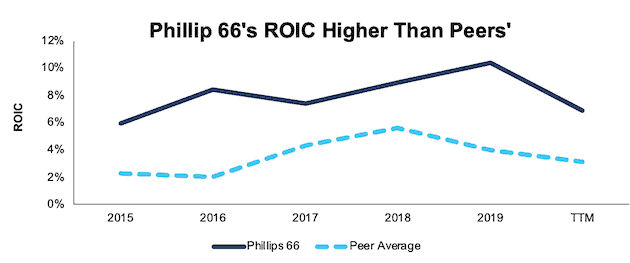
Phillips 66’s high margins and superior invested capital turns help drive the firm’s rising return on invested capital (ROIC). Per Figure 4, Phillips 66’s ROIC improved from 6% in 2015 to 10% in 2019, before falling to 7% TTM while the market-cap-weighted average of peers’ ROIC slightly improved from 2% in 2015 to 3% TTM.
Figure 4: ROIC vs. Peers
Sources: New Constructs, LLC and company filings.
Unless you believe that there will be no need for petroleum products in a post-COVID-19 world, it’s hard to argue against Phillips 66’s ability to survive. And, if it survives, it’s hard to argue against the firm’s superior profitability before the crisis translating into profits in a recovery.
Phillips 66 is More Than a Refinery
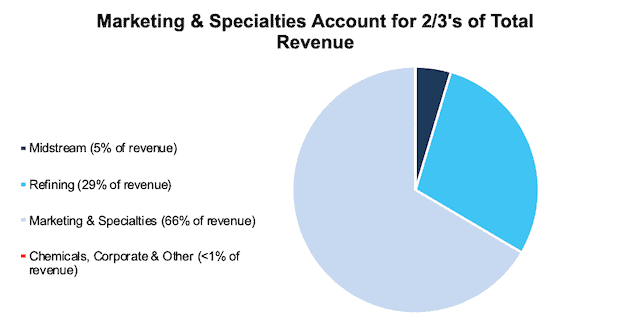
In our previous Long Idea on HollyFrontier (HFC), we highlighted the benefits of being a refinery middleman, which include insulation from prolonged pricing fluctuations that exploration and production companies face. Phillips 66 enjoys the same middleman advantage, plus it operates in several businesses outside of pure refining. Per Figure 5, Phillips 66’s marketing and specialties segment accounts for 66% of the firm’s total revenue.
Figure 5: 2019 Revenue by Segment
Sources: New Constructs, LLC and company filings.
Taking Advantage of a Diversified Approach
Unlike an integrated oil company, Phillips 66’s refining business does not make large capital investment bets on exploration and production of crude oil. Instead, the firm’s extensive pipeline network allows it to source its raw material from a variety of sources and enjoy more stable margins. The firm owns or leases over 21,000 miles (~7.5 times the distance from New York City to Los Angeles) of pipeline systems. This pipeline network allows Phillips 66 to purchase crude oil from the most advantageously-priced markets across the U.S., Canada, South and Central America, Europe, and the Middle East and Africa.
The firm’s Marketing and Specialties segment, which buys and resells refined petroleum products, further diversifies its revenue and operates through two channels – wholesale and retail. Wholesale marketing is geared towards distributing refined products to markets that do not require an extensive transportation network, i.e. they’re close to existing refineries. In regions not as close to refineries, the firm utilizes its extensive network of over 7,500 branded (Phillips 66, Conoco, and 76) outlets across the U.S to resell these products.
As a diversified business, Phillips 66 is less volatile than a pure refiner. For example, in 1Q20, while the refinery segment was losing money, the marketing and specialties segment offset some of the refining losses by taking advantage of higher margins caused by the decline in oil prices.
Joint Ventures Provide Additional Sources of Profit
The firm’s exposure to other business segments extends beyond what its revenue streams reveal. Phillips 66 has a 50% stake in DCP Midstream Partners (DCP), a company engaged in logistics, gathering, and marketing natural gas and natural gas liquids (NGLs). It also is heavily invested in chemicals. The firm owns 50% of Chevron Phillips Chemical Company LLC (CPChem), a joint venture with Chevron. The firm also owns 50% of WRB Refining LP (WRB), a joint venture that owns two refineries. Combined, these equity affiliates have contributed $6.1 billion to the firm’s bottom line, or 33% of its three-year non-operating profit before tax (NOPBT). CPChem alone contributed $2.2 billion over the past three years, or 12% of the firm’s three-year NOPBT.
Demand for Oil Will Return
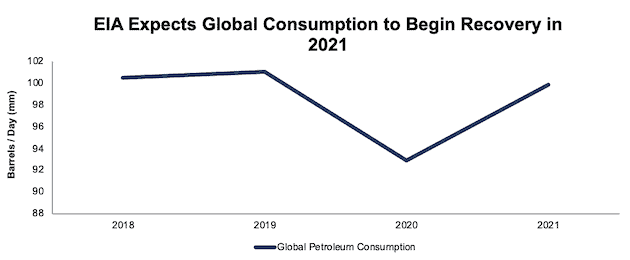
There is no denying that COVID-19 disruptions hurt global oil demand. The International Energy Agency (IEA) expects global petroleum consumption to drop from 101 million barrels per day (bpd) to 93 million bpd, an 8% year-over-year (YoY) decline. The IEA also forecasts demand to recover 8% to 100 bpd in 2021. This expectation means that after a year of COVID-related decline, oil will recover to within 1% of pre-COVID levels.
Figure 6: EIA Global Petroleum and Other Liquids Consumption in Barrels per Day (Millions)
Sources: New Constructs, LLC and EIA.
Best of all, we’re already seeing signs of a recovery. Last year, the U.S. consumed over 20 million bpd on average. Demand in June was ~18 million bpd, which was up from ~15 bpd in April. In other words, consumption in June was just 14% below 2019’s average.
Refining Operations Will Grow in the Midst of EV Headwinds
Longer term, demand for electric vehicles (EV) pose a threat to future refining cash flows, but perhaps not as much as expected. In March of 2019, 1.8% of all vehicles in the U.S. were EVs. The Edison Electric Institute expects EVs will be just ~7% of all vehicles on U.S. roads in 2030. This rise in EV demand is reflected in the IEA’s expectation for a decline in U.S. gasoline demand over the 2020-2025 period.
While gasoline demand in the U.S. may decline, global demand for petroleum products will rise. The reference case for U.S. refineries expects U.S. exports liquid fuels will not peak until the early 2030s. This export growth is supported by the International Maritime Organization’s regulations starting in 2020 to reduce sulfur in fuel oil that ships use. Many international refineries lack the capability to process fuel that meets the new requirements. Phillips 66 is investing to expand its exporting capabilities to take advantage of increased global demand.
Phillips 66 has already been shifting away from gasoline sales. The firm’s Marketing and Specialties gasoline sales have declined by 1% compounded annually over the past two years, while the firm’s distillates (jet fuel, heating kerosene, diesel, and lower-sulfur fuel fuels) sales have improved by 9% compounded annually over the same time. The focus on distillates drove a 7% compounded annual growth in total refined petroleum product sales from 2017 to 2019.
Prudently Investing for the Future
As noted earlier, Phillips 66’s executives’ compensation is strongly tied to the firm’s efficient use of capital. The firm recently introduced its AdvantEdge66 plan aimed at creating value through technology, innovation, and value chain optimization.
Phillips 66 is focused on implementing new technology to better integrate information and communication flow between its separate business segments to remove operational inefficiencies. Phillips 66 has also recently completed several investments aimed at improving margins. The firm completed an upgrade of two refineries that will enable them to produce much higher margin low sulfur fuel oil. The firm also recently completed a project at its Lake Charles’ refinery, increasing its higher-octane gasoline blend components by 25,000 bpd. Additionally, Phillips 66 increased its distillate production after upgrades to several of its refineries.
Phillips 66 is also growing and investing in its retail business. Last year, it entered into a joint venture which will add 680 (9% of its current 7,520 branded sites) additional sites on the West Coast to further increase the firm’s exposure to retail margins.
Since 2015, the firm has remodeled 4,200 U.S. retail locations. Last year alone, the firm remodeled 1,600 locations. In 2019, remodeled locations saw a 3.5% increase in volume compared to locations that were not remodeled. Improving the customer experience helps build greater brand loyalty, with the added benefit of increased revenues at remodeled stores.
The fact that the firm generated $10.7 billion in free cash flow since 2015 while also engaging in all of these capital improvement projects speaks to the firm’s uniquely high level of profitability in the past. This past profitability positions the firm to earn high returns on these investments and grow profitability in the future.
PSX Is Undervalued
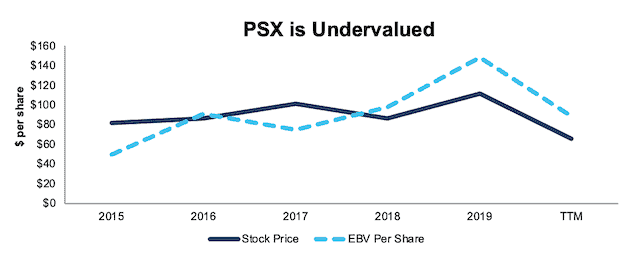
After falling 41% year-to-date (YTD) to $64/share, PSX now trades below its economic book value[3] (EBV), or no-growth value. Its current price-to-economic book value (PEBV) ratio of 0.7 is the cheapest since 2012. This ratio means the market expects Phillip 66’s NOPAT to permanently decline by 30%. This expectation seems overly pessimistic over the long term. For reference, Phillip 66 has grown NOPAT by 12% compounded annually over the past three years.
Phillip 66’s current economic book value is $88/share – a 38% upside.
Figure 7: Stock Price vs. Economic Book Value (EBV) per Share With 9-Year Average WACC
Sources: New Constructs, LLC and company filings.
PSX’s Current Price Implies No Economic Recovery
Phillips 66 is priced as if the COVID-driven economic decline will permanently depress its profits. Below, we use our reverse DCF model to quantify the cash flow expectations baked into Phillips 66’s current stock price. Then, we analyze the implied value of the stock based on different assumptions about COVID-19’s impact on the economy and Phillips 66’s future growth in cash flows.
Scenario 1: Using historical revenue declines, historical margins, and average historical GDP growth rates, we can model the worst-case scenario already implied by Phillips 66’s current stock price. In this scenario, we assume:
- NOPAT margins fall to -0.3% (all-time low in 2014, compared to 4% TTM) in 2020, increase to 3% (nine-year average) in 2021 and 2022, and increase to 4% (five-year average) each year thereafter
- Revenue falls 33% (more than IBIS World’s estimated Petroleum Refining industry decline of 22% in 2020) in 2020 and does not grow from 2021 to 2022 (vs. 2021 consensus +21%)
- Sales begin growing again in 2023, but only at 3% a year, which is below the average global GDP growth rate since 1961 of 3.5%
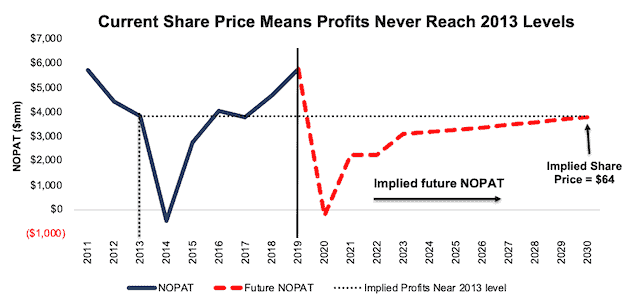
In this scenario, where Phillips 66’s NOPAT declines 4% compounded annually over the next eleven years (including a drop to -$230 million 2020), the stock is worth $64/share today – equal to the current stock price. See the math behind this reverse DCF scenario.
For reference, when Phillips 66 faced challenging commodity prices in 2014, the firm’s NOPAT fell to -$467 million before exceeding 2013 levels just two years later.
Figure 8 compares the firm’s implied future NOPAT in this scenario to its historical NOPAT. This worst-case scenario implies Phillips 66’s NOPAT eleven years from now will be 34% below its 2019 NOPAT. In other words, this scenario implies that a decade after the COVID-19 pandemic, Phillips 66’s profits will have only recovered to 1% below 2013 NOPAT levels. Phillips 66 also surpassed this profit level in 2011, 2012, 2016, 2018, and 2019. In any scenario better than this one, PSX holds significant upside potential, as we’ll show below.
Figure 8: Current Valuation Implies Severe, Long-Term Decline in Profits: Scenario 1
Sources: New Constructs, LLC and company filings.
Scenario 2: Long-term View Could Be Very Profitable
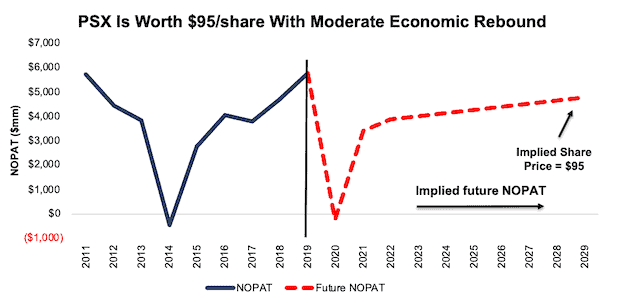
If we assume, as does the International Monetary Fund (IMF) and nearly every economist in the world, that the global economy rebounds and returns to growth starting in 2021, PSX is undervalued.
In this scenario, we assume:
- NOPAT margins fall to -0.3% (all-time low in 2014, compared to 4% TTM) in 2020 and increase to 4% (five-year average) each year thereafter
- Revenue falls 33% (more than IBIS World’s estimated Petroleum Refining industry decline of 22% in 2020) in 2020 and grows 14% YoY in 2021 and 2022 (below 2021 and 2022 consensus +21%)
- Sales grow from 2023 and each year thereafter at 3% a year, which is below the average global GDP growth rate since 1961 of 3.5%
In this scenario, Phillips 66’s NOPAT falls by 2% compounded annually over the next decade (including a drop to -$230 million 2020) and the stock is worth $95/share today – a 48% upside to the current price. See the math behind this reverse DCF scenario.
For comparison, Phillips 66 has grown NOPAT by 12% compounded annually over the past three years and from -$467 million in 2014 to $5.7 billion in 2019. It’s not often investors get the opportunity to buy a growing company at such a discounted price.
Figure 9 compares the firm’s implied future NOPAT in scenario 2 to its historical NOPAT. This scenario implies that a decade from now, Phillips 66’s NOPAT will be 17% below NOPAT in 2019 and 16% below NOPAT in 2011. If profits return to these levels in less than 10 years, PSX has even more upside potential.
Figure 9: Implied Profits Assuming Moderate Recovery: Scenario 2
Sources: New Constructs, LLC and company filings.
Sustainable Competitive Advantages Will Drive Shareholder Value Creation
Here’s a summary of why we think the moat around Phillips 66’s business will enable it to continue to generate higher NOPAT than the current market valuation implies. The following competitive advantages help Phillips 66 survive the downturn and return to growth as the economy rebounds:
- Strong balance sheet to survive the economic dip
- Large distillate production driving higher margins
- Higher profitability than peers
- Significant capital investment to drive higher revenues and margins going forward
What Noise Traders Miss with Phillips 66
These days, fewer investors focus on finding quality capital allocators with shareholder friendly corporate governance. Instead, due to the proliferation of noise traders, the focus is on short-term technical trading trends while high-quality fundamental research is overlooked. Here’s a quick summary of what noise traders are missing:
- Diversified business segments reduce volatility
- Phillips 66’s investments for increased exports
- Valuation implies midstream industry never recovers
Nearly 6% Dividend Yield Supported by Cash Flow
The firm has increased its dividend in each of the past eight years. From 2015 to 2019, the firm generated more in in free cash flow ($10.7 billion) than it paid out in dividends ($6.9 billion), or an average $1.1 billion surplus each year. Over the TTM, the firm has generated $3.1 billion in FCF while paying out $1.6 billion in dividends. Its last quarterly dividend, when annualized, equals $3.60/share and provides a 5.7% yield.
Firms with cash flows greater than dividend payments have a higher likelihood to maintain and grow dividends.
Historically, Phillips 66 has also returned capital to its shareholders through share repurchases. However, the firm stated in its 1Q20 conference call that it suspended share repurchases. Before suspending repurchases, Phillips 66 repurchased $10.4 billion (37% of current market cap) over the past five years. The firm has $2.5 billion remaining for future purchases under its current authorization. A return to repurchasing shares once the economy stabilizes, or even returns to growth, would provide additional yield for investors.
A Consensus Beat or Signs of Recovery Could Send Shares Higher
According to Zacks, consensus estimates at the end of January pegged Phillips 66’s 2020 EPS at $9.81/share. Jump forward to July 27 and consensus estimates for Phillips 66’s 2020 EPS have fallen to $1.83/share. 2021 estimates follow a similar trend. At the end of January, 2021 EPS consensus was $10.13/share and has since fallen to $5.71/share.
Though the COVID-19 pandemic has reduced demand for petroleum products, these lowered expectations provide a great opportunity for a strong company, such as Phillips 66, to beat consensus. Our current Earnings Distortion Score, which is a short-term indicator of the likelihood to beat or miss expectations, for Phillips 66 is “Beat.” The lowered expectations moving forward make it much easier for the firm to beat earnings.
The firm beat EPS estimates in 11 of the past 12 quarters, and doing so again, in the midst of such market turmoil, could send shares higher.
Insider Trading and Short Interest Trends
Over the past twelve months, insiders have bought a total of 117 thousand shares and sold 165 thousand shares for a net effect of 48 thousand shares sold. These sales represent less than 1% of shares outstanding.
There are currently 5.6 million shares sold short, which equates to 1% of shares outstanding and under two days to cover. While short interest is up 21% from the prior month, overall, it remains low and shows that not many investors are willing to bet against this firm.
Critical Details Found in Financial Filings by Our Robo-Analyst Technology
As investors focus more on fundamental research, research automation technology is needed to analyze all the critical financial details in financial filings as shown in the Harvard Business School and MIT Sloan paper, "Core Earnings: New Data and Evidence”.
Below are specifics on the adjustments we make based on Robo-Analyst findings in Phillips 66’s 2019 10-K:
Income Statement: we made $3.5 billion of adjustments, with a net effect of removing $2.7 billion in non-operating expenses (3% of revenue). You can see all the adjustments made to Phillips 66’s income statement here.
Balance Sheet: we made $20.9 billion of adjustments to calculate invested capital with a net increase of $6.4 billion. One of the largest adjustments was $11.1 billion in deferred tax assets. This adjustment represented 23% of reported net assets. You can see all the adjustments made to Phillips 66’s balance sheet here.
Valuation: we made $24.2 billion of adjustments with a net effect of decreasing shareholder value by $24.2 billion. There were no adjustments that increased shareholder value. Apart from total debt and deferred tax liabilities, one of the most notable adjustments to shareholder value was $2.3 billion in minority interests. This adjustment represents 8% of Phillips 66’s market cap. See all adjustments to Phillips 66’s valuation here.
Attractive Funds That Hold PSX
The following funds receive our Attractive-or-better rating and allocate significantly to PSX:
- Alta Quality Growth Fund (AQLGX) – 3.1% allocation and Attractive rating
- RNC Genter Dividend Income Fund (GDIIX) – 3.0% allocation and Very Attractive rating
- SPDR MFS Systematic Value Equity ETF (SYV) – 2.6% allocation and Attractive rating
- Eaton Vance Focused Value Opportunities Fund (EIFVX) – 2.6% allocation and Attractive rating
- Eaton Vance Tax-Managed Value Fund (ECTVX) – 2.5% allocation and Attractive rating
This article originally published on July 29, 2020.
Disclosure: David Trainer, Kyle Guske II, and Matt Shuler receive no compensation to write about any specific stock, style, or theme.
Follow us on Twitter, Facebook, LinkedIn, and StockTwits for real-time alerts on all our research.
[1] Our core earnings are a superior measure of profits, as demonstrated in Core Earnings: New Data & Evidence a paper by professors at Harvard Business School (HBS) & MIT Sloan. The paper empirically shows that our data is superior to “Operating Income After Depreciation” and “Income Before Special Items” from Compustat, owned by S&P Global (SPGI).
[2] Peers in this analysis include Exxon Mobil Corp (XOM), Chevron Corporation (CVX), BP, PLC (BP), China Petroleum & Chemical Corporation (SNP), Suncor Energy Inc (SU), Marathon Petroleum Corp (MPC), Valero Energy Corp (VLO), Hess Corporation (HES), Imperial Oil Ltd (IMO), Hollyfrontier Corp (HFC), Cosan Ltd (CZZ), Murphy Usa, Inc. (MUSA), CVR Energy, Inc. (CVI), World Fuel Services Corp (INT), Delek US Holdings, Inc. (DK), PBF Energy Inc. (PBF), and Clean Energy Fuels Corp (CLNE)
[3] We utilized the override capability in our Company Valuation Model to calculate PSX’ TTM EBV using the firm’s nine-year average weighted average cost of capital (WACC) to derive an EBV that is less sensitive to any changes in WACC. This approach is especially useful in the current low interest rate environment. While we do not know where interest rates will go in the future, calculating EBV with longer-term average WACC gives a more conservative EBV in the event interest rates increase in the future.
