
We published an update on EB on Nov 8, 2021. A copy of the associated Earnings Update report is here.
Check out this week’s Danger Zone interview with Chuck Jaffe of Money Life.
Online ticketing platform Eventbrite (EB: $23/share) went public on Thursday, September 20. At an offering price of $23 per share, the company planned to raise up to $230 million with an expected market cap of ~$1.8 billion. At the IPO price, EB currently earns our Unattractive rating.
Eventbrite’s IPO reminds us of Dropbox (DBX). Both platforms:
- Are successful with lower-end and/or low-paying/free users but now need to target a more profitable customer base
- Operate in relatively commodified businesses with low margins
- Have dual-class share structures that give public shareholders almost no say in corporate governance.
This report aims to help investors sort through Eventbrite’s financial filings to understand the fundamentals and valuation of this IPO.
Losses Aren’t as Bad as They Seem
EB earns revenues by charging a combination of percentage and flat fees to event promoters (“creators” in the company’s terminology) for each ticket sold on its platform. In 2017, over 700 thousand creators issued 203 million tickets on Eventbrite. The company earned $202 million in revenue from these ticket sales, up 51% from 2016.
At first glance, EB’s GAAP losses stayed consistent over the past two years, at -$40 million in 2016 and -$39 million in 2017. However, Figure 1 shows that economic earnings, the true cash flows of the business, improved significantly. The company’s economic losses declined from -$38 million in 2016 to -$20 million in 2017.
Figure 1: EB GAAP Net Income and Economic Earnings Since 2016
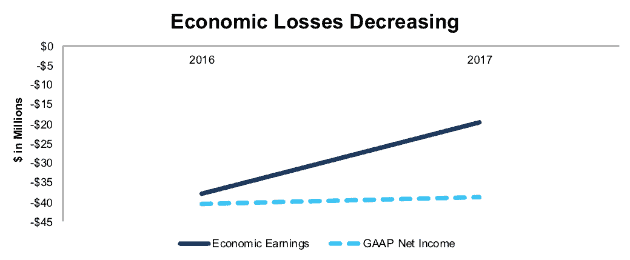
Sources: New Constructs, LLC and company filings
Non-operating items overstated EB’s GAAP losses in 2017, which masked the fundamental improvement in the business. Adjusting to remove these non-operating items reveals the company’s narrowing losses.
In 2017, Robo-Analyst[1] uncovered non-operating items, such as:
- $21.9 million (11% of revenue) in charges related to tax reform
- $7.3 million (4% of revenue) in acquisition related costs
- $2.7 million (1% of revenue) in impairments
After these adjustments, we removed net $26.6 million in non-operating expenses in 2017, which resulted in economic losses being 49% lesser than GAAP losses.
With only two years of history, it’s difficult to draw any firm conclusions about the trend in the business, but our adjustments show that the company moved significantly closer to profitability in 2017.
Unprofitable Customers Are A Long-Term Problem
EB has successfully attracted creators through word of mouth, as 95% of its creators signed themselves up for the platform directly. However, that 95% of creators accounts for just 54% of revenue, which means that the remaining 5% of creators that EB signs up through direct sales efforts account for 46% of its revenue.
Similar to Dropbox, EB has built a customer base that is large but not particularly profitable. The majority of its creators host small events, many of which are free. Just 71 million (35%) of the 203 million tickets issued through Eventbrite in 2017 generate revenue.
EB claims it will generate significant profit growth by (a) converting its existing free creators to paid, and (b) growing the revenue from its existing paid creators, but it has yet to do so. In 2017, the revenue from existing creators declined by 3% year over year. For EB’s up-selling strategy to be successful, revenue growth needs to be significantly positive, not negative.
EB’s other growth strategy is to move upmarket and sign up larger creators. That strategy forces it to compete with well-entrenched, powerful companies like Ticketmaster (LYV) and StubHub (EBAY). Ticketmaster, as part of Live Nation, also has the advantage of vertical integration, as it both hosts events and sells tickets for them.
Growth Through Acquisitions Destroys Value
Acquisitions have been a key component of EB’s growth strategy. Over the past two years, the company has spent $239 million (121% of invested capital) on acquisitions. These large acquisitions add significant goodwill to the balance sheet and put the company at risk for future write-downs. Goodwill accounts for 80% of EB’s invested capital, the 20th highest percentage out of the 2,867 companies we cover.
These acquisitions disguise the real customer acquisition costs that EB faces by shifting those costs from the income statement to the balance sheet. Through the first six months of 2018, revenue grew faster than sales and marketing costs, at 61% vs. 54% year-over-year respectively. However, much of that revenue growth came from acquisitions, and organic revenue growth was only 39%. EB’s customer acquisition strategy is not more efficient than others as it claims. When investors consider the money EB pays to acquire smaller competitors as part of its customer acquisition cost, this business looks much weaker.
Don’t Trust Reported Cash Flow
EB claims positive free cash flow as a significant selling point for investors. According to its filings, EB earned $21 million in free cash flow in 2017.
This free cash flow number ignores significant costs, including stock-based compensation and cash paid for acquisitions. Our models show that, once you account for these costs, EB’s free cash flow is -$104 million and its free cash flow yield ranks near the bottom for all the IPO’s we’ve covered so far in 2018.
Figure 2: Free Cash Flow Yield For 2018 IPO’s
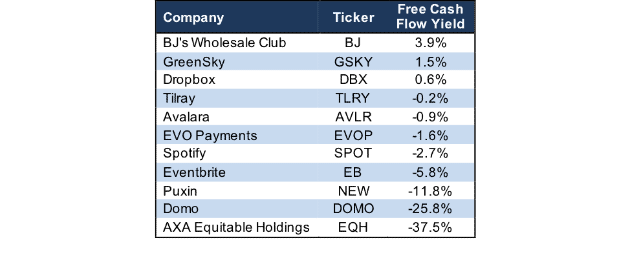
Sources: New Constructs, LLC and company filings
If EB plans to use acquisitions as a primary driver of growth, it can’t exclude the money it pays for them from free cash flow.
Share Class Structure Leaves No Real Power for Investors
EB plans to list shares using the dual class structure that has become the default for recent IPOs. We showed how the dual-class structure that prevents investors from holding executives accountable contributes to the dysfunction and falling share price at Snap Inc. (SNAP).
EB’s governance structure at least does not give total control to the founders. Venture capital funds Tiger Global and Sequoia Capital both hold significant Class B shares that will allow them to advocate for shareholder interests. Still, the Class A shares that are sold in the IPO will only have 1.5% voting power in the company. Why should investors by shares that are stripped of the basic shareholder right to vote?
Our Discounted Cash Flow Model Reveals EB is Overvalued
When we use our dynamic DCF model to analyze the future cash flow expectations baked into the stock price, we find that EB is overvalued at the price of its IPO.
Due to its position as a middleman in a commodity business, EB has little margin leverage and will need to grow rapidly to justify its valuation. To justify its IPO price of ~$23/share, EB must grow its NOPAT margin from -6% to 2.5% (comparable to LYV) and grow revenue by 40% compounded annually for the next 10 years. See the math behind this dynamic DCF scenario.
In this scenario, EB would earn $5.8 billion in revenue in year 10, which translates to ~41.9 billion paid tickets at its current monetization of $3/ticket. EB estimates its total addressable market as 1.1 billion paid tickets, so it must expand its addressable market by 75% – either by entering new geographic markets or diversifying its services – and achieve a dominant market share to simply justify its valuation.
If EB achieves the same margins as above but only grows revenue by 20% compounded annually for 10 years, the stock is worth ~$4/share today, an 84% downside from the IPO price. See the math behind this dynamic DCF scenario. In this scenario, EB would earn $1.2 billion in revenue in year 10, which equates to 415 million tickets and a 38% market share.
Critical Details Found in Financial Filings by Our Robo-Analyst Technology
As investors focus more on fundamental research, research automation technology is needed to analyze all the critical financial details in financial filings. Below are specifics on the adjustments[2] we make based on Robo-Analyst findings in Eventbrite’s S-1:
Income Statement: we made $34 million of adjustments, with a net effect of removing $27 million in non-operating expense (13% of revenue). You can see all the adjustments made to EB’s income statement here.
Balance Sheet: we made $336 million of adjustments to calculate invested capital with a net decrease of $149 million. The most notable adjustment was a $22 million midyear acquisition adjustment to account for acquisitions made later in the year. This adjustment represented 7% of reported net assets. You can see all the adjustments made to EB’s balance sheet here.
Valuation: we made $339 million of adjustments with a net effect of decreasing shareholder value by $62 million. There were no adjustments that increased shareholder value. Apart from $113 million in total debt, the largest adjustment to shareholder value was $79 million in outstanding employee stock options. This option adjustment represents 5% of EB’s proposed market cap.
This article originally published on September 20, 2018.
Disclosure: David Trainer, Kyle Guske II, and Sam McBride receive no compensation to write about any specific stock, style, or theme.
Follow us on Twitter, Facebook, LinkedIn, and StockTwits for real-time alerts on all our research.
[1] Harvard Business School features the powerful impact of research automation in the case New Constructs: Disrupting Fundamental Analysis with Robo-Analysts.
[2] Ernst & Young’s recent white paper “Getting ROIC Right” demonstrates the link between an accurate calculation of ROIC and shareholder value.