Reported earnings don’t tell the whole story of a company’s profits. Without analyzing the footnotes and MD&A, investors don’t see the entire picture. This firm’s reported earnings understate its true profitability, and future profit growth expectations embedded in the stock price look overly pessimistic. With improving profitability, strong macro-economic tailwinds, and an undervalued share price, this stock could outperform moving forward. Standard Motor Products (SMP: $49/share) is this week’s Long Idea.
Standard Motor Products’ Improving Profitability
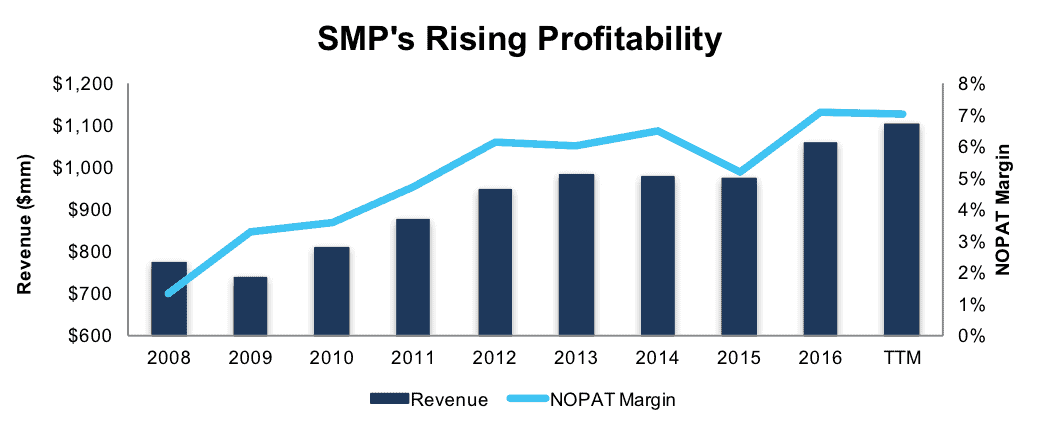
Since 2008, Standard Motor Products has grown revenue 4% compounded annually. Over the same time, after-tax profit (NOPAT) has increased by 28% compounded annually to $75 million in 2016 and $78 million over the last twelve months (TTM). Profit growth has been fueled by SMP’s improving NOPAT margin, which has increased from 1% in 2008 to 7% TTM per Figure 1.
However, investors analyzing Standard Motor Products reported GAAP net income see an understated version of the firm’s profitability. In 2016, we made $27 million of total adjustments with the net effect of removing $15 million in non-operating expenses. After all adjustments, SMP’s 2016 NOPAT was 24% higher than reported GAAP net income. The largest adjustment was $7.5 million in non-operating expenses hidden in operating earnings related to the acquisition of General Cable Corporation’s wire business, found on page 30 of SMP’s 2016 10-K.
Figure 1: SMP Profitability Improvement Since 2008
Sources: New Constructs, LLC and company filings
In addition to NOPAT growth, SMP has generated a cumulative $147 million (13% of market cap) in free cash flow (FCF) over the past five years. Standard Motor’s has also exhibited good stewardship of capital and has earned a positive return on invested capital (ROIC) in every year of our model, which dates to 1998. SMP currently earns a 13% ROIC, which is in the second quintile of our coverage universe.
Executive Compensation Plan Is Directly Aligned With Creating Shareholder
Standard Motor’s executive compensation plan includes base salary, annual incentives, and long-term stock based compensation. 70% of annual cash incentives are tied to improvements in Economic Value Added (EVA), also known as economic earnings. EVA has been a target metric in Standard Motor’s executive compensation plan since 1998. SMP’s compensation committee uses EVA because “the principles of an EVA program have a better statistical correlation with the creation of value for stockholders than a cash incentive program based on performance measures.”
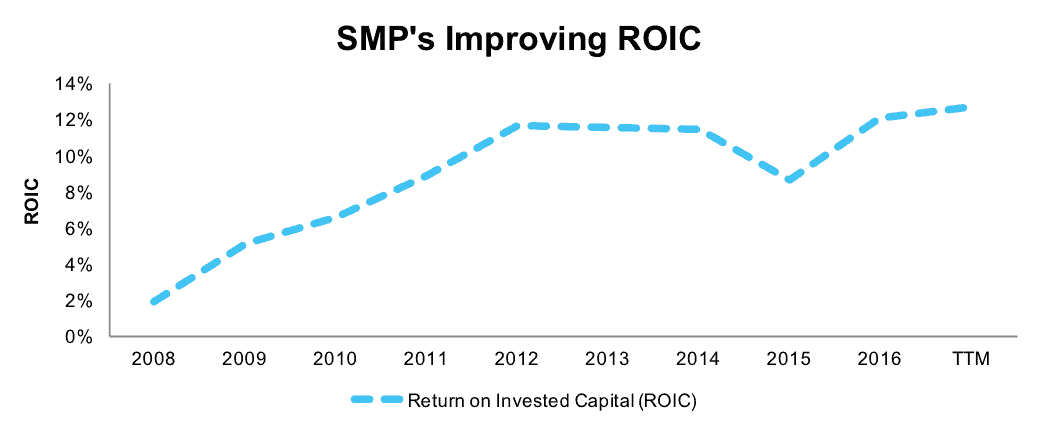
The focus on EVA helps ensure executives continue to be good stewards of capital and as SMP states, “EVA recognizes the productive use of capital assets and, therefore, wise, responsible decision-making regarding capital investments.” Per Figure 2, SMP’s ROIC has improved from 2% in 2008 to 13% TTM. In addition, SMP has grown economic earnings from -$13 million in 2008 to $43 million TTM.
Figure 2: Standard Motor’s Good Stewardship of Capital
Sources: New Constructs, LLC and company filings
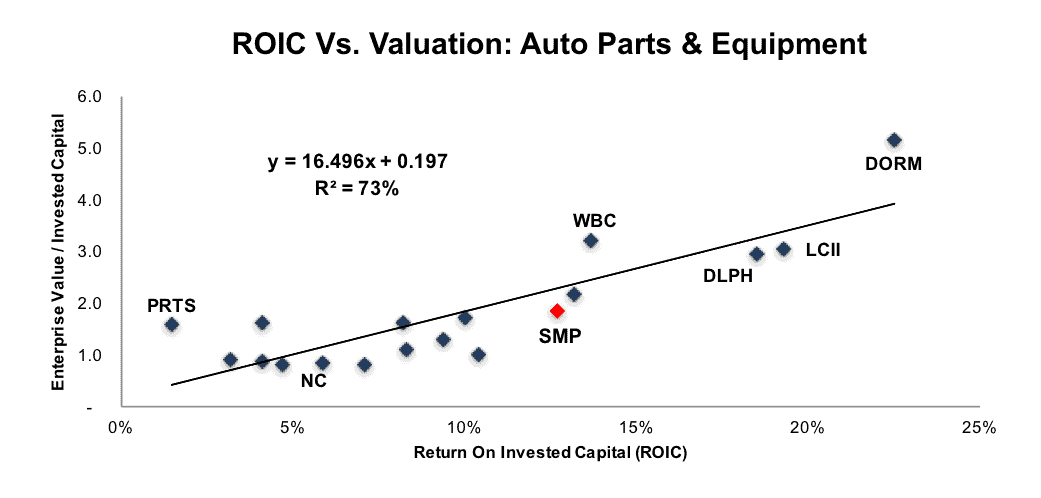
We know from Figure 3 below, and numerous case studies, that ROIC is directly correlated to changes in shareholder value, a fact not lost on SMP’s compensation committee. Given that ROIC is the most important driver of EVA, or economic earnings, SMP’s use of EVA to measure performance ensures executives’ interests are aligned with shareholders’ interests.
Improving ROIC Correlated with Creating Shareholder Value
Per Figure 3, ROIC explains 73% of the changes in valuation for the 18 Auto Parts & Equipment peers. Despite SMP’s 13% ROIC, above the 10% average of the peer group, the firm’s stock trades at a discount to peers as shown by its position below the trend line in Figure 3. If the stock were to trade at parity with its peers, it would be $61/share – 25% above the current stock price. Given the firm’s rising ROIC, shareholder-aligned executive compensation plan, and consistent profit growth, one would think the stock would garner a premium valuation.
Figure 3: ROIC Explains 73% Of Valuation for Auto Parts & Equipment Firms
Sources: New Constructs, LLC and company filings
SMP’s Profitability Helps Maintain Market Leading Positions
As a leading manufacturer of replacement parts in the automotive aftermarket, Standard Motor Products faces competition from firms across the globe such as Dorman Products (DORM), ACDelco, Robert Bosch, and Visteon Corp (VC) among others. Per Figure 4, SMP’s NOPAT margin ranks near the top of its competition.
Healthy margins have allowed SMP to invest in new product development and internal initiatives such as plant improvements and workforce efficiency measures. SMP is also able to withstand pricing pressures from competition. Lastly, SMP’s margins have enabled the company to weather economic downturns, such as the 2008/2009 economic recession, while remaining profitable.
Figure 4: SMP’s Profitability Ranks Highly Among Peers
Sources: New Constructs, LLC and company filings.
Bear Concerns Ignore Used Vehicle Trends
Standard Motor Products’ segments (engine management and temperature control) are tied to the automotive aftermarket. The automotive aftermarket follows trends such as number of vehicles on the road, average age per vehicle, average miles driven per year, and even new car quality. Many SMP bear case arguments overlook these trends in favor of focusing on factors less pertinent to SMP such as new car sales.
In 2016, registrations for light vehicles in the U.S. reached a record level of 264 million, an increase of 2.4% year-over-year. This growth in registration surpassed the 2.1% growth in 2015. More vehicles on the road provides an opportunity for the aftermarket repair industry.
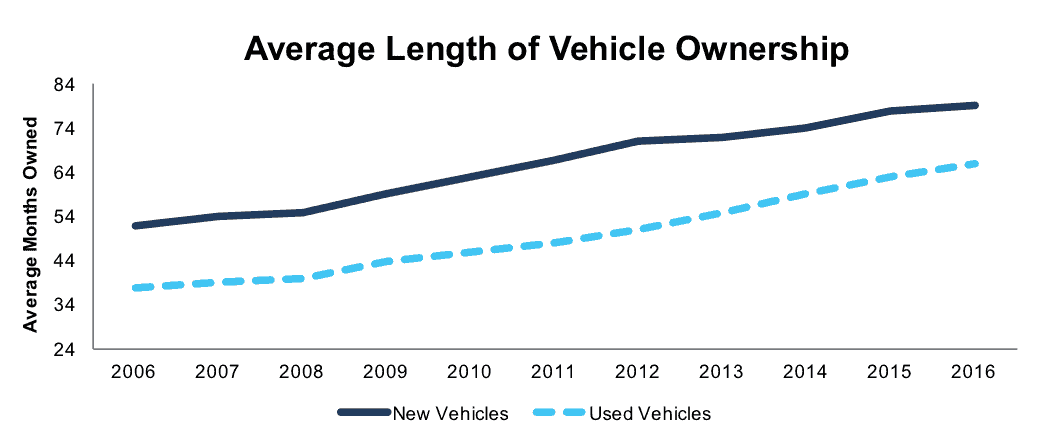
In addition to the sheer number of vehicles rising, the average age of light vehicles in the U.S. rose to 11.6 years in 2016, up from 9.6 years in 2002, when IHS Automotive began tracking the data. Alongside a rising average age of cars, consumers are owning vehicles for record lengths of time. Per Figure 5, the average length of ownership of vehicles has consistently risen since 2006. In 2016, the average length of ownership for new vehicles was 79 months, up from 52 in 2006. Similarly, the average length of ownership for used vehicles was 66 months in 2016, up from 38 in 2006.
Figure 5: Vehicle Ownership Length Reaches All-Time Highs
Sources: New Constructs, LLC and IHS Automotive
The average miles driven per year is also rising alongside the average age of vehicles and length of ownership. Vehicle miles travelled per year has risen from 230 billion in March 2000 to 265 billion in March 2017, according to the U.S. Department of Transportation. As average mileage increases, so does the need for repairs and maintenance. Per Figure 6, total maintenance costs per 25,000 miles driven rises significantly as total miles driven increases.
Figure 6: Vehicle Maintenance Costs Rise As Mileage Driven Increases
Sources: New Constructs, LLC and Your Mechanic
The industry trends of an aging auto fleet combined with longer car ownership periods and increased miles driven per year should provide tailwinds for SMP’s profit growth going forward. The positive macro trends coupled with internal efficiency and cost savings initiatives weaken the bear case in our view.
To capitalize on these tailwinds, Standard Motor Products’ is continuously looking to lower its manufacturing costs and maximize profitability. In recent years, the firm has relocated manufacturing plants, shifted production to higher capacity plants, divested facilities, and increased efforts to source materials at lower costs. These efforts have allowed the company’s costs to rise in-line with or below its 3-4% long-term revenue growth rate. Since 2006, selling, general & administrative costs have grown 3% compounded annually while cost of goods sold rose only 2% compounded annually.
Bears may raise concerns about Standard Motor Products’ revenue concentration. In 2016, O’Reilly Automotive (ORLY), NAPA Auto Parts (GPC), Advance Auto Parts (AAP), and AutoZone (AZO) accounted for 20%, 18%, 17%, and 11% of revenue respectively. Each of these retailers are well recognized names in the automotive aftermarket industry and have grown sales anywhere between 4-11% compounded annually over the past four years. As noted above, the economic trends pushing the automotive aftermarket will also provide tailwinds to automotive parts retailers, as consumers and service shops increasingly need replacement parts. The revenue concentration would be more an issue if it was limited to fewer retailers, but the current diversification among a group of four growing retailers is less concerning.
Lastly, SMP’s low valuation also undermines many bear arguments. Despite improving profitability and strong economic trends, SMP’s current valuation implies a permanent decline in profits, as we’ll show below.
SMP’s Valuation Implies Permanent Drop in Profits
Over the past two years, SMP is up 37% while the S&P is up 14%. However, year-to-date, SMP has fallen 9% while the S&P is up 7%. This price decline without a deterioration in business fundamentals results in SMP being undervalued. At its current price of $49/share, SMP has a price-to-economic book value (PEBV) ratio of 0.9. This ratio means the market expects Standard Motor Products’ NOPAT to permanently decline by 10%. This expectation seems overly pessimistic for a firm that has grown NOPAT by 28% compounded annually since 2008 and 4% compounded annually since 1998.
Even if SMP were to never again grow profits from current levels, the economic book value, or no growth value of the firm is $54/share – a 10% upside from the current valuation.
However, if SMP can maintain TTM NOPAT margins (7%) and grow NOPAT by just 4% compounded annually for the next decade, the stock is worth $65/share today – a 33% upside. This scenario assumes SMP can grow revenue by consensus estimates in 2017 (6%) and 2018 (3%), and 3% each year thereafter. With the average age of cars increasing and consumers owning cars longer, SMP could easily meet or surpass these expectations. Add in the potential yield detailed below, and it’s clear why SMP could be a great portfolio addition.
Buy Backs Plus Dividend Could Yield Nearly 3%
In 2016, Standard Motor’s repurchased $400,000 of its stock, which exhausted its remaining authorization. SMP repurchased nearly $20 million in 2015 and $10 million in 2014. In February 2017, the board of directors authorized the purchase of up to $20 million under a new repurchase program. Through April 2017, SMP has repurchased $3 million. Going forward, if SMP were to average the last three years repurchase activity ($10 million per year), the firm’s existing authorization would last two years. A repurchase of this size is 1% of the current market cap. When combined, Standard Motor Products’ 1% repurchase yield and 1.6% dividend yield offer investors a total potential yield of nearly 3%.
Aging Population of Cars Could Spur Earnings Surprise
As noted above, the average age of vehicles is on the rise and consumers are owning cars longer than ever. More importantly, according to IHS Automotive, the oldest vehicles on the road are the fastest growing component of the total fleet. Vehicles 16 years and older are expected to grow over 30% through 2021. Similarly, more than 20 million vehicles on the road in 2021 will be more than 25 years old. These cars will require maintenance and repairs to ensure their continued usability.
16+ year old vehicles aren’t the only subset expected to grow either. Vehicles that are 12 years old are expected to grow 10% through 2021, and vehicles new to five years old are expected to grow 16% through 2021. Essentially, across all subsets of the vehicle landscape, the need for and cost of repairs should be expected to rise (per Figure 6 above).
With rising demand, SMP is well positioned to capitalize on the growth of the automotive aftermarket. The firm is moving product line production to maximize plant efficiency and looking at strategic acquisitions, such as its recent purchase of General Cable Corporation’s wire business. This acquisition furthers SMP’s goal of lower-cost material sourcing. With improving margins and revenue growth opportunities, beating both top and bottom line expectations should prove an effective catalyst to send shares higher. SMP beat both top and bottom line expectations from 1Q16 to 3Q16 and the stock rose 26% over the same time.
With low market expectations, SMP could be poised for another beat and subsequent increase in valuation. In the meantime, investors in this stock carry very low valuation risk and are rewarded with a potential 3% total yield given SMP’s history of dividends and share repurchases.
Insider Trends and Short Interest Are Minimal
Over the past 12 months, there have been 47 thousand insider shares purchased and 93 thousand insider shares sold for a net effect of 46 thousand insider shares sold. These sales represent less than 1% of shares outstanding. Additionally, short interest sits at 298 thousand shares, or 1% of shares outstanding.
Impact of Footnotes Adjustments and Forensic Accounting
Our Robo-Analyst technology enables us to perform forensic accounting with scale and provide the research needed to fulfill fiduciary duties. In order to derive the true recurring cash flows, an accurate invested capital, and an accurate shareholder value, we made the following adjustments to Standard Motor’s 2016 10-K:
Income Statement: we made $27 million of adjustments, with a net effect of removing $15 million in non-operating expense (1% of revenue). We removed $6 million in non-operating income and $21 million in non-operating expenses. You can see all the adjustments made to SMP’s income statement here.
Balance Sheet: we made $314 million of adjustments to calculate invested capital with a net increase of $139 million. The largest adjustment was $70 million due to asset write-downs. This adjustment represented 14% of reported net assets. You can see all the adjustments made to SMP’s balance sheet here.
Valuation: we made $114 million of adjustments with a net effect of decreasing shareholder value by $114 million. There were no adjustments that increased shareholder value. The largest adjustment was $112 million in total debt, which includes $30 million in operating leases. This lease adjustment represents 3% of SMP’s market cap. Despite the net decrease in shareholder value, SMP remains undervalued.
Attractive Funds That Hold SMP
The following funds receive our Attractive-or-better rating and allocate significantly to SMP.
- Royce Special Equity Fund (RSEIX) – 3.9% allocation and Attractive rating.
- Aasgard Dividend Growth Small & Mid Cap Fund (AADGX) – 2.0% allocation and Very Attractive rating.
- Royce Small/Mid Cap Premier Fund (RHFHX) – 2.0% allocation and Attractive rating.
This article originally published on May 30, 2017.
Disclosure: David Trainer and Kyle Guske II receive no compensation to write about any specific stock, style, or theme.
Follow us on Twitter, Facebook, LinkedIn, and StockTwits for real-time alerts on all our research.
Click here to download a PDF of this report.
Photo Credit: Mic (Flickr)


