
To support the narrative that earnings growth remains strong, we think S&P 500 corporate managers purposefully understated their first half 2022 earnings so that second half earnings would look better by comparison. The evidence of this sandbagging comes from Operating Earnings [as calculated by S&P Global (SPGI)] and GAAP Earnings for S&P 500 companies dropping lower than Core Earnings[1] for the first time in a while. See Figure 1 for details.
This report leverages our cutting-edge Robo-Analyst technology to deliver proven-superior[2] fundamental research and support more cost-effective fulfillment of the fiduciary duty of care.
Legacy Earnings Disagree About the Market’s Profitability
In the trailing-twelve-months (TTM) ended 2Q22:
- S&P Global’s Operating Earnings are 1% lower than Core Earnings, after being 4% higher in 1Q22,
- GAAP Earnings are 3% lower than Core Earnings, after being 4% higher in 1Q22,
- Street Earnings, which are marketed as being adjusted to remove non-recurring items, are 9% higher than Core Earnings, after being 9% higher in 1Q22.
The abrupt quarter-over-quarter drop in Operating and GAAP Earnings could be the beginning of another “kitchen-sink” period, or corporate managers sandbagging first half performance to make it easier to achieve relative growth over the rest of the year. We most recently saw the kitchen-sink effect in 2020, when companies used COVID-19 as a justification to write down more assets than in any year since 2008. Now, with high inflation, rising interest rates, and global turmoil, companies could be using a similar playbook in anticipation of another market meltdown.
Figure 1: Operating vs. Street vs. GAAP vs. Core Earnings: S&P 500 Since Mid 2021
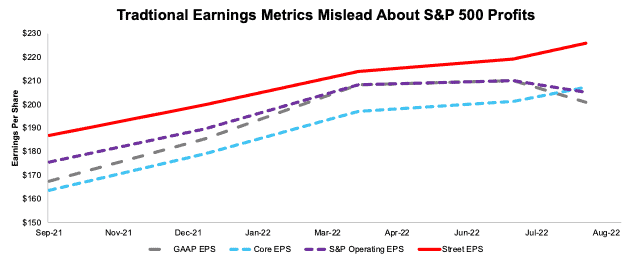
Sources: New Constructs, LLC, company filings, and S&P Global (SPGI). Note: the most recent period’s data for SPGI’s Operating Earnings is based on consensus estimates for companies with a non-standard fiscal year.
Below we highlight the disconnect between traditional earnings measures and our Core Earnings and examine the changes in each metric in recent periods. Flaws in legacy datasets (detailed in The Journal of Financial Economics) drive the difference between the measures. Core Earnings simply do a better job of accounting for unusual gains/losses buried in footnotes that legacy datasets fail to capture.
Street Earnings Continue to Overstate S&P 500 Profits
Street Earnings, unlike GAAP and Operating Earnings, continue to overstate Core Earnings in the TTM ended 2Q22. Quarter-over-quarter in 2Q22:
- Street Earnings improved from $219.37/share to $225.83/share, or 3%
- Core Earnings improved from $201.16/share to $207.37/share, or 3%
In the TTM ended 2Q22, Street Earnings are 9% higher than Core Earnings, which remains the same as in 1Q22.
Get more details on the S&P 500 companies in 2Q22 with overstated Street Earnings here and understated Street Earnings here.
Figure 2: Trailing Twelve Month Earnings: Core Earnings vs. Street Earnings: 4Q19 –2Q22
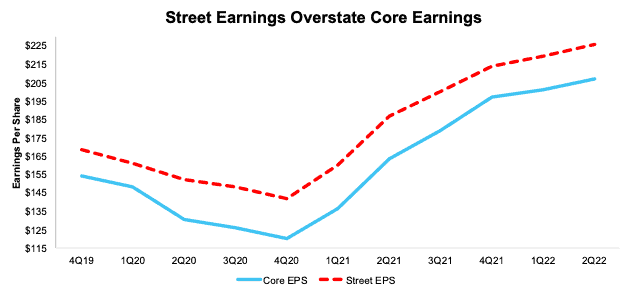
Sources: New Constructs, LLC, company filings, and Zacks Earnings
S&P Global’s Operating Earnings Fall Is Not Reflected in Core Earnings
In 2Q22, Operating Earnings for the S&P 500 understate Core Earnings for the first time since 3Q20.
In 2Q22, Operating Earnings fell 2% QoQ while Core Earnings rose 3% QoQ in 2Q22. Operating Earnings are 1% lower than Core Earnings in 2Q22.
Year-over-year (YoY), 2Q22 Core Earnings improved at a faster pace, rising 27%, compared to Operating Earnings, which rose 17%.
Get more details on our Core Earnings vs. Operating Earnings in 2Q22 here.
Figure 3: Trailing Twelve Month Earnings: Core Earnings vs. SPGI Operating Earnings: 4Q19 –2Q22
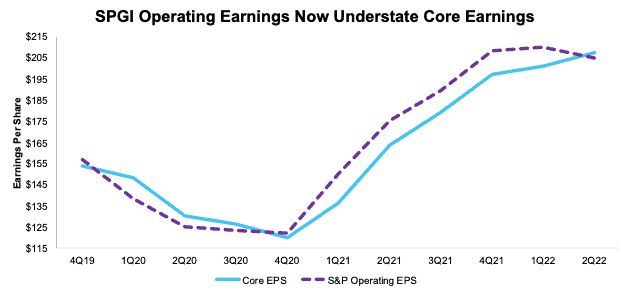
Sources: New Constructs, LLC, company filings, and S&P Global (SPGI). Note: the most recent period’s data for SPGI’s Operating Earnings is based on consensus estimates for companies with a non-standard fiscal year.
Core Earnings Are More Reliable than GAAP Earnings
In 2Q22, GAAP Earnings for the S&P 500 understated Core Earnings for the first time since 1Q21. The drop in GAAP Earnings relative to Core Earnings follows a similar pattern to just prior to the Great Recession.
In 2Q22, GAAP Earnings fell 4% QoQ while Core Earnings rose 3% QoQ in 2Q22. Over a longer time frame, since 2020, corporate profits have fluctuated less than indicated by GAAP earnings. For instance:
- In 2020, GAAP earnings fell 30% YoY compared to an 18% fall for Core Earnings.
- In 2021, GAAP earnings rose 108% YoY compared to a 62% rise for Core Earnings.
- In the TTM ended 2Q22, GAAP earnings rose 20% YoY compared to a 27 rise for Core Earnings.
Get more details on our Core Earnings vs. GAAP Earnings for the S&P 500 in 2Q22 here.
Figure 4: Trailing Twelve Month Earnings: GAAP Earnings vs. Street Earnings: 4Q19 –2Q22
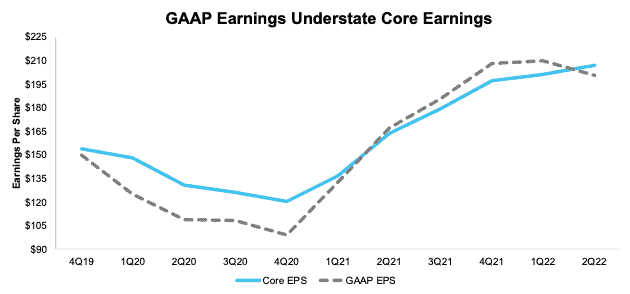
Sources: New Constructs, LLC and company filings
Diligence Matters – Superior Fundamental Analysis Provides Insights
As traditional earnings measures both over and understate the S&P 500’s Core Earnings, the index requires more earnings growth than analysts expect to justify its current valuation and stop price declines. Based on macro-economic factors, such as high inflation, pending energy crises around the world, continued supply chain disruptions and more, investors can expect more companies warning about slowing earnings growth or even outright decline in coming quarters. While the kitchen sink is easy to spot in hindsight, the fall in GAAP earnings could be a leading indicator of what’s to come in the near future.
Our measure of Core Earnings leverages cutting-edge technology to provide clients with a cleaner and more comprehensive view of earnings. Investors armed with our measure of Core Earnings have a differentiated and more informed view of the fundamentals of companies and sectors, which allows them insights to find high-quality and low-quality stocks, generate alpha, and fulfill the fiduciary duty of care.
This article originally published on September 15, 2022.
Disclosure: David Trainer, Kyle Guske II, Matt Shuler, and Brian Pellegrini receive no compensation to write about any specific stock, style, or theme.
Follow us on Twitter, Facebook, LinkedIn, and StockTwits for real-time alerts on all our research.
Appendix I: Core Earnings Methodology
In the Figures above, we use the following to calculate Core Earnings:
- aggregated quarterly data for constituents in the S&P 500 for each measurement period post 6/30/13 to the present
[1] Our Core Earnings research is based on the latest audited financial data, which is the calendar 2Q22 10-Q in most cases.
[2] Our research utilizes our Core Earnings, a more reliable measure of profits, as proven in Core Earnings: New Data & Evidence, written by professors at Harvard Business School (HBS) & MIT Sloan and published in The Journal of Financial Economics.