
As the market raced to record-highs, we’ve identified several stocks that fiduciaries cannot reasonably justify owning or recommending given the abnormally large disconnect between valuation and fundamentals.
Our “Most Dangerous Stocks for Fiduciaries” thesis acknowledges that the performance of these stocks has rarely, if ever, been about valuation and fundamentals. Nevertheless, fiduciaries should consider how much risk they take by owning these stocks anywhere close to current levels.
Most Dangerous Stocks for Fiduciaries
Figure 1 shows that most of the ideas published in our “Most Dangerous Stocks for Fiduciaries article have underperformed the S&P 500 as shorts since being published.
Figure 1: See Through the Dip Stocks vs. S&P 500 – Prices Through September 22, 2020
Sources: New Constructs, LLC and company filings.
These eight stocks are not only overvalued, but the underlying fundamentals are weak and/or trending in the wrong direction. Further, each company shares many of the following traits:
- Negative or falling core earnings
- Inferior return on invested capital (ROIC), NOPAT margin and/or invested capital turns compared to peers
- Lack of competitive advantages or defensible moat
- Valuations that imply taking significant market share, sometimes greater than the total addressable market (TAM)
Below are excerpts from recent reports that illustrate the extreme risk in the abnormally high cash flow expectations baked into these stocks.
Wayfair Inc. (W) – Unattractive Rating
Read the entire report here: This Online Retailer Is Furnishing Investors With Risk
We put Wayfair in the Danger Zone on August 17, 2020. Since then, stock is down 3% (S&P 500 -2% and given a highly competitive market and Wayfair’s expensive valuation, the stock could fall much further.
Already Priced to Outpace Amazon’s Growth Trajectory
Despite deteriorating fundamentals and more profitable competition, Wayfair is priced as if it will grow even faster than Amazon once it became profitable.
To justify its current price of ~$300/share, Wayfair must:
- Achieve YoY revenue growth of 84% (equal to 2Q20 YoY increase vs. 2020 consensus of 52%) in 2020 and maintain a 20% compounded annual revenue growth rate each year thereafter (vs. five-year average consensus of 18%)
- Immediately achieve a 2% NOPAT margin (vs. -4% TTM) in 2020 and 2021 and increase NOPAT margin to 4.6% (equal to Amazon’s TTM NOPAT margin) in 2022 and each year thereafter
See the math behind this reverse DCF scenario. In this scenario, Wayfair’s revenue in 2029 would reach $83.1 billion, which is greater than Target’s TTM revenue ($80.1 billion), nearly equal to the combined TTM revenue of Lowe’s and eBay ($84.8 billion), and nearly five times the combined TTM revenue of Bed, Bath & Beyond (BBBY), Williams-Sonoma, and Overstock.com (OSTK). Ten years after it first reached profitability, Amazon’s revenue was just $48.1 billion, or 42% below Wayfair’s implied 2029 revenue.
Figure 2 shows the revenue growth expectations baked into the stock price compared to Amazon’s revenue growth from 2001 to 2011. In this scenario, Wayfair will achieve positive NOPAT in 2020 (vs. -$480 million TTM). We chose to compare Wayfair against Amazon’s performance from 2001 to 2011 since this period represents the first ten years of Amazon achieving positive NOPAT.
Figure 2: Revenue Growth Implied by Wayfair’s Stock Price
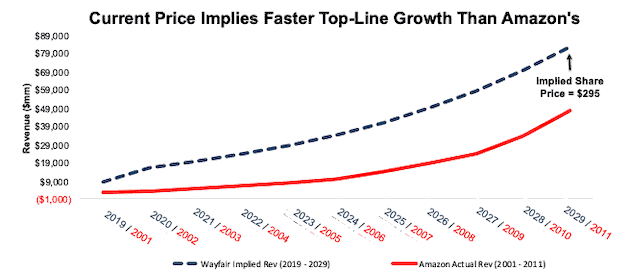
Sources: New Constructs, LLC and company filings.
In this scenario, Wayfair’s NOPAT reaches $3.8 billion (vs.-$480 million TTM) in 2029 or ~10 years. For comparison, Amazon needed 16 years to generate $4 billion in NOPAT after it first achieved profitability.
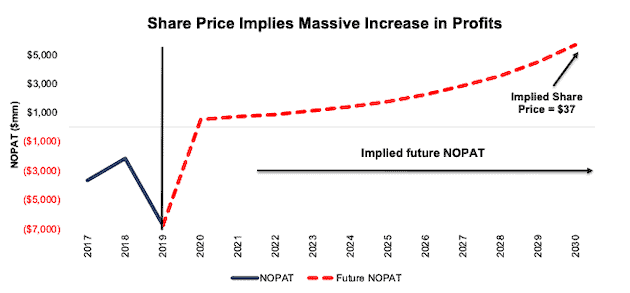
Figure 3 compares the firm’s implied future NOPAT in this scenario to Amazon’s actual NOPAT from 2001 to 2011 (Amazon’s first ten years of profitability). This scenario assumes Wayfair will achieve profitability for the first time ever in 2020 like Amazon did in 2002. In any scenario worse than this one, W holds significant downside risk.
Figure 3: NOPAT Growth Implied by Wayfair’s Stock Price
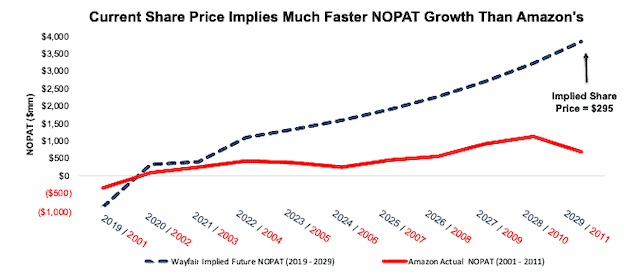
Sources: New Constructs, LLC and company filings.
Tesla Inc. (TSLA) – Unattractive Rating
Read the entire report here: Tesla: The Most Dangerous Stock for Fiduciaries
We put Tesla in the Danger Zone on August 18, 2020 and updated the pricing data post stock-split on September 2, 2020. Since mid-August, the stock is up ~12% (S&P 500 -2%). While the stock has underperformed as a short and may continue to do so after the hyped batter day, downside risk remains large.
Doing the Math: Reverse DCF Analysis Reveals Unrealistic Expectations
Below we use our reverse DCF model to illustrate how overvalued the stock is in the face of the increasingly competitive electric vehicle (EV) market.
We also want to take a moment to recognize that the performance of this stock has rarely, if ever, been about valuation and that it has earned tremendous returns for many, many investors. Nevertheless, we think the time has come for those with fiduciary responsibilities to consider just how much risk they take by owning TSLA at anywhere close to current levels.
At its current price of ~$400, Tesla is priced as if it will not only achieve the scale and production of a mass-market automaker and capture a majority of the global electric vehicle market but do so while maintaining its well-above-average vehicle prices. Below, we quantify the cash flow expectations baked into Tesla’s current stock price.
Already Priced for Market Dominance:
To justify its current price of ~$400/share, Tesla must:
- Immediately achieve a 7% NOPAT margin, which is equal to Toyota’s NOPAT margin (7%), and above Tesla’s TTM NOPAT margin of 5.6%.
- Grow revenue by 31% compounded annually for the next 11 years, which given the margin improvement, means NOPAT grows 49% compounded annually over the same time.
- Grow revenue, NOPAT and FCF without increasing working capital or fixed assets – a highly unlikely assumption that creates a truly best-case scenario. For reference, Tesla’s invested capital has grown 56% compounded annually since 2010 and 36% compounded over the past five years.
See the math behind this reverse DCF scenario. In this scenario, Tesla would earn $479 billion in revenue 11 years from now, (which would equal 60% of 2027’s projected global total addressable market for EVs) and the firm’s NOPAT in 2030 would equal $33 billion (vs. $1.5 billion TTM). For comparison, Toyota, the world’s second largest (by revenue) automobile manufacturer, generated TTM NOPAT of $13.9 billion, or 41% of Tesla’s expected NOPAT.
Over the TTM period, only three companies generated NOPAT greater than the NOPAT implied by Tesla’s valuation: Apple (AAPL) at $54.5 billion, Microsoft (MSFT) at $44.8 billion, and JPMorgan Chase & Company (JPM) at $39.1 billion.
Figure 4 illustrates the expectations baked into Tesla’s stock price compared to the expectations baked into the next three largest auto manufacturers by market cap: Toyota, Honda Motors, and General Motors. As you can see, the market currently prices the three incumbents as if profits will severely and permanently drop, while Tesla’s profits will soar.
Figure 4: Current Valuation Implies Tesla Profits Soar and Competitors Fall
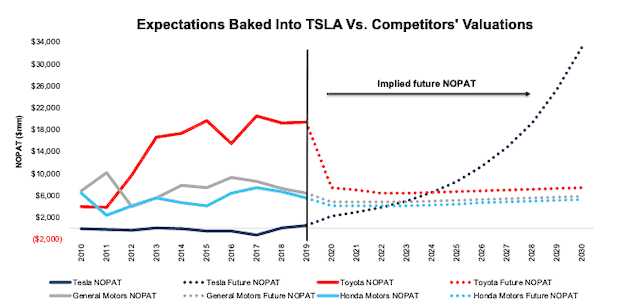
Sources: New Constructs, LLC and company filings.
No One Expects the Revenues Implied by Tesla’s Stock Price
Per Figure 5, at its current ASP of ~$57k, the current stock price implies the firm will sell 8.5 million vehicles in 2030, or 33% of the entire global EV market in 2030 and 1,591%[1] more than expected sales in 2020.
Figure 5: Current Valuation Implies Significant Increase in Number of Vehicles Sold
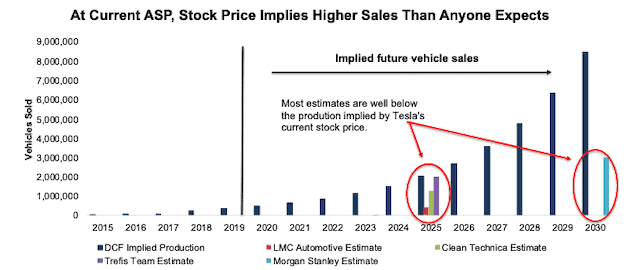
Sources: New Constructs, LLC, company filings, LMC Automotive, Clean Technica, Trefis Team & Morgan Stanley.
If Tesla’s ASP falls to ~$37k, or the average car price in the U.S. in 2019, its implied sales volume in 2030 increases to 13.0 million vehicles in 2030, or 50% of projected global EV sales in that year and 2,490% more than expected sales in 2020.
Even if Tesla meets the most optimistic estimate and sells 2 million vehicles by 2025, can it make another quantum leap in production from 2 million to 8.5 million, or 13.0 million, by 2030?
Morgan Stanley analyst Adam Jonas projects Tesla will sell 3 million units a year by 2030, or one-third of the sales volume implied by its valuation. The implied value of the stock based on sales of 3 million units in 2030 at the ~$57k ASP is $133/share today – a 67% downside.
We think it is highly unlikely that Tesla will ever sell such a high volume of cars at its current ASP because the luxury car market is not very large[2] relative to the overall automobile market. The fact of the matter is that there are not very many people on earth that are wealthy enough to afford such an expensive car.
So, investors should consider the implied vehicle sales by 2030 based on lower ASPs that are required to justify TSLA’s valuation at ~$400/share:
- 13.0 million vehicles - ASP of $37k (average car price in U.S. in 2019)
- 20.1 million vehicles - ASP of ~$24k (equal to Toyota)
- 30.1 million vehicles - ASP of ~$16k (equal to General Motors[3])
Below are the percentages of expected global EV sales in 2030 that those numbers of vehicles represent:
- 50% for 13.0 million vehicles
- 77% for 20.1 million vehicles
- 116% for 30.1 million vehicles
Figure 6 provides another view into how overvalued TSLA is at current levels. It shows how many vehicles Tesla must sell at lower ASPs compared to Toyota and GM’s actual 2019 vehicle sales.
Tesla’s valuation implies the company will either sell more cars at a higher ASP than there are buyers or more cars at a lower ASP than the largest automakers in the world.
Figure 6: Tesla’s Implied Vehicle Sales vs. Toyota and General Motors’ 2019 Results
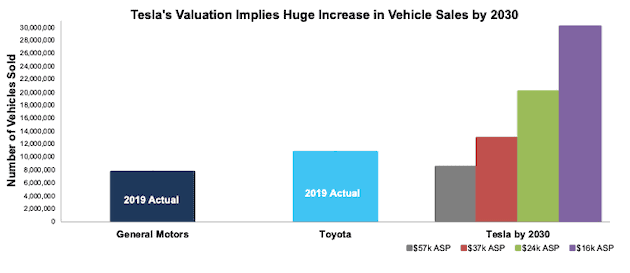
Sources: New Constructs, LLC and company filings.
In other words, Tesla’s current valuation assuming a $37k ASP implies that, by 2030, the firm will produce and sell at least 21% more vehicles than Toyota and 68% more than GM produced in 2019. Such an increase in production appears well beyond the realm of possibility for a firm that has struggled as much and taken as long as it has to reach 368,000 vehicles sold.
Meanwhile, the incumbents’ stock prices imply their vehicle production (measured from 2019 levels) will have declined by 7% in 2030
Owning or recommending clients own TSLA at these levels does not appear to be a fiduciarily-responsible option, in our opinion.
Uber Technologies (UBER) – Unattractive Rating
Read the entire report here: The Emperor Has No Clothes – Uber’s Business Model Is Broken
We put Uber in the Danger Zone on August 24, 2020. Since then, stock is up ~11% (S&P 500 -3%) despite no fundamental improvement in the firm’s operations. While the stock has underperformed as a short, and may continue to do so in the short term, Uber’s busines model is broken and the stock holds significant downside risk.
Doing the Math: Valuation Implies More Market Share Than Is Available
As we continue through the first economic recession in Uber’s history, we think shares can fall significantly. We use our reverse DCF model to analyze the expectations implied by the stock price and find that UBER needs to take over 100% of its total addressable market (TAM) to justify its valuation.
To justify its current price of ~$35/share, Uber must immediately improve its pre-tax margin to 4% (compared to -34% TTM) which is similar to airlines prior to consolidation and grow revenue by 26% compounded annually for the next 11 years. See the math behind this reverse DCF scenario.
In this scenario, Uber would earn nearly $57 billion in revenue in 2025 and $180 billion in 2030. At its TTM take rate, this scenario equates to ~$276 billion in gross bookings in 2025. For reference, Mordor Intelligence projects the TAM for ridesharing will be $210 billion in 2025. Grand View Research projects the TAM for food delivery will be ~$64 billion in 2025, for a combined TAM of ~$273 billion.
In other words, to justify its current stock price, Uber must capture over 100% of the projected 2025 rideshare and food delivery TAMs combined, per Figure 7.
Figure 7: Uber’s Valuation Implies Bookings Will Surpass TAM in 2025
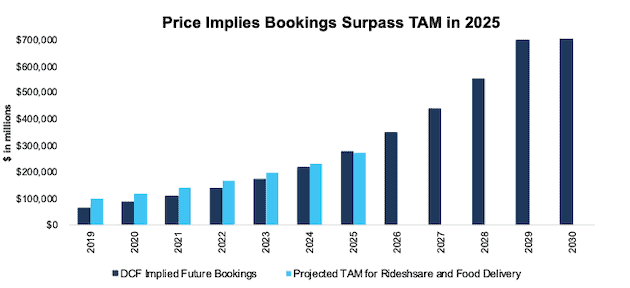
Sources: New Constructs, LLC, company filings, Mordor Intelligence, and Grand View Research.
Figure 8 compares the firm’s implied future bookings ($878 billion in 2030) in this scenario to its historical bookings, along with the expected TAM of ridesharing and food delivery in 2025.
For reference, as of August 2020, Uber holds 71% of the U.S. rideshare market and ~32% of the U.S. food delivery market, which includes the recent acquisition of Postmates.
Figure 8: Uber’s Valuation Implies 101% Market Share in 2025
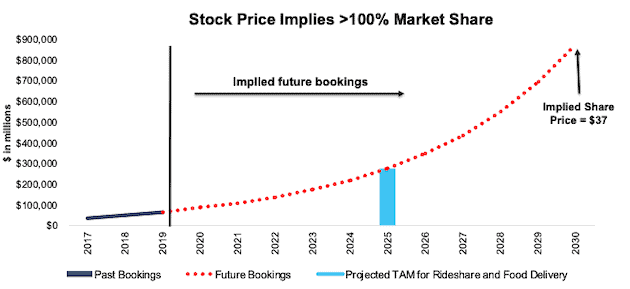
Sources: New Constructs, LLC, company filings, Mordor Intelligence, and Grand View Research.
For comparison, we compare the revenue implied by Uber’s stock price to the four largest airlines by passengers carried, per Figure 9. Uber’s current stock price implies its revenue in 2030 will be $180 billion, or 14% above the combined 2019 revenue of Delta (DAL), American (AAL), United (UAL), and Southwest (LUV) of $158 billion.
Figure 9: Uber’s Valuation Implies Massive Revenue Growth
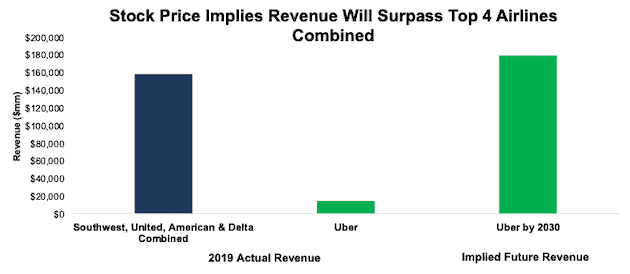
Sources: New Constructs, LLC and company filings.
Figure 10 compares the firm’s implied future NOPAT in this scenario to its historical NOPAT. In any scenario worse than this one, UBER holds significant downside risk.
Figure 10: Current Valuation Implies Uber Will Generate More NOPAT Than Delta or FedEx (FDX)
Sources: New Constructs, LLC and company filings.
Carvana Co. (CVNA) – Unattractive Rating
Read the entire report here: You Won’t Find a Bargain With This Car Dealer
We featured Carvana as a Sell Idea on August 26, 2020. Since then, stock is up 9% (S&P 500 -3%), but given the firm’s lack of competitive advantage, we think shares could fall much further.
Doing the Math: Even Carvana Doesn’t Believe the Expectations Implied by Its Price
Despite deteriorating fundamentals and stronger competitors, Carvana is priced as if it will grow 5x larger than CarMax (KMX), which is the current largest used car dealer in the U.S.
To justify its current price of ~$227/share, Carvana must:
- Grow revenue at 42% (vs. consensus estimates of 34% in 2020, 46% in 2021, and 34% in 2022) compounded annually over the next decade
- Immediately achieve a 4% (equal to peer group TTM margin) NOPAT margin (compared to -9% TTM)
See the math behind this reverse DCF scenario. In this scenario, Carvana’s revenue in 2029 would reach $135 billion, which is 132% of the combined TTM revenue of each of the firms listed in our original report.
Last year, Carvana generated a total of $3.9 billion in revenue and sold 217 thousand combined retail and wholesale vehicles – or $18 thousand in revenue per unit sold. Assuming inflation of 3.5% per year, revenue per unit sold in 2029 would be ~$26 thousand, at which point, the firm would need to sell ~5.2 million retail and wholesale vehicles to achieve $135 billion of revenue.
Such a high number would probably shock even Carvana’s optimistic CEO, Ernest Garcia III, who stated last year, “we believe we can sell two million cars per year.” Not only does the current price imply the firm sells more than twice the number of cars the CEO expects, it also implies the firm takes over 10% of the current market share. For reference, CarMax, the largest used car dealer in the U.S. holds just 2% of the market.
Figure 11 shows the NOPAT growth expectations baked into the stock price compared to the firms historical NOPAT. In this scenario, Carvana will grow NOPAT from -$272 million in 2019 to $5.4 billion in 2029.
Figure 11: Carvana’s Valuation Implies 5x the Market Share of CarMax
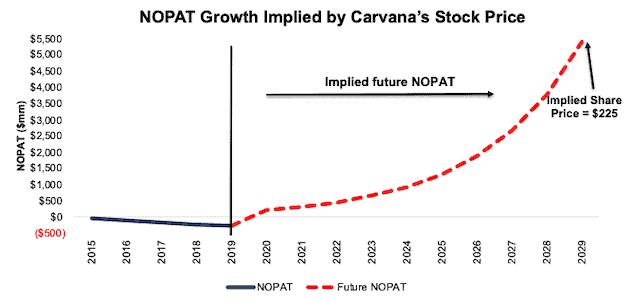
Sources: New Constructs, LLC and company filings.
Beyond Meat (BYND) – Very Unattractive Rating
Read the entire report here: Competition Will Eat This Firm Alive
We featured Beyond Meat as a Sell Idea on September 2, 2020. Since then, stock is up ~19% (S&P 500 -7%) despite no fundamental improvement in the firm’s operations. While the stock has underperformed as a short and may continue to do so in the short term, Beyond Meat’s business faces significant competition and the stock holds substantial downside risk.
Doing the Math: Valuation Implies Significant Disruption of the Entire Meat Industry
With low margins and little control over the majority of distribution, we think shares can fall sharply from current levels. When we use our reverse DCF model to analyze the expectations implied by the stock price, BYND appears significantly overvalued.
To justify its current price of ~$154/share, Beyond Meat must immediately improve its NOPAT margin to 5% (same as Tyson and more than double its current margin of 2%) and grow revenue by 38% compounded annually for the next 12 years. The margin improvement means NOPAT would grow 43% compounded annually in this scenario. See the math behind this reverse DCF scenario. Figure 12 compares the firm’s implied future NOPAT in this scenario to its historical NOPAT.
Figure 12: Current Valuation Implies Beyond Meat Will Generate More NOPAT Than Pilgrim’s Pride (PPC)
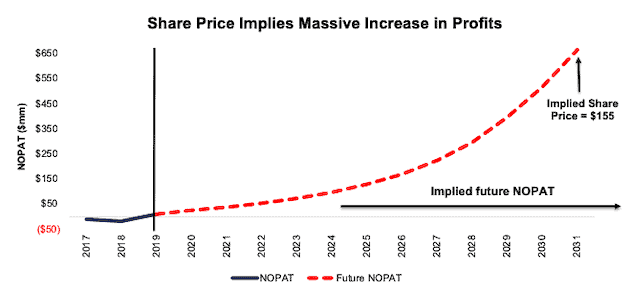
Sources: New Constructs, LLC and company filings.
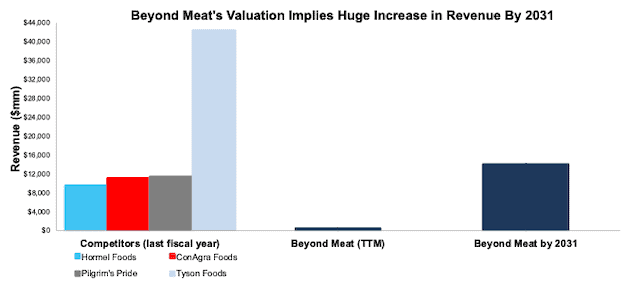
In this scenario, Beyond Meat would earn ~$14 billion (more than MarketsandMarkets’ 2019 estimated global plant-based meat market size of $12.1 billion) in revenue in 2031, compared to $401 million TTM. For comparison, this scenario implies Beyond Meat would generate more sales than incumbent competitors such as Pilgrim’s Pride (PPC), ConAgra Foods (CAG), and Hormel Foods (HRL) in their last fiscal years.
Furthermore, Beyond Meat’s current valuation implies it will generate sales equal to 33% of Tyson’s 2019 revenue – a level that places it as the sixth largest meat and poultry processor in the world in 2019. See Figure 13 for details.
Figure 13: Current Valuation Implies Significantly Greater Revenue Than Many Incumbents
Sources: New Constructs, LLC and company filings.
Shopify Inc. (SHOP) – Unattractive Rating
Read the entire report here: Don’t Add This Risk To Your Cart
We featured Shopify as a Sell Idea on September 10, 2020. Since then, stock is up ~2% (S&P 500 -1%). This short-term underperformance (as a short) looks unlikely to last as the market realizes SHOP is priced for near perfection, and any lapse in execution leaves large downside risk.
Doing the Math: SHOP Must Take a Large Share of Its Addressable Market
We think Shopify’s operating segments, subscription solutions and merchant solutions, correlate most closely to the web content management market (projected by Prescient & Strategic Intelligence to grow at 18.4% per year) and the global payment gateway market (projected by Grand View Research to grow at 21.5% per year). Using these growth rates, the total addressable markets (TAM) for these two markets are estimated to be $22.8 billion and $71.2 billion in 2027, respectively. Therefore, we estimate the TAM for Shopify to be $94 billion in 2027.
Shopify is priced as if it will achieve massive growth in revenue and profits and grow to be 51% of its TAM.
To justify its current price of ~$950/share, Shopify must:
- Grow revenue by 53% compounded annually (which includes 66% growth in 2020, which equals consensus estimates for 2020) for the next eight years
- Immediately achieve a 17% (equal to peer group TTM margin) NOPAT margin (compared to -3% TTM)
See the math behind this reverse DCF scenario. In this scenario, Shopify’s revenue in 2027 would be over 30 times higher than its 2019 revenue.
Figure 14 shows the revenue growth expectations baked into the stock price compared to the firms historical revenue. In this scenario, Shopify will grow revenue from $1.6 billion in 2019 to $47.5 billion in 2027, or 51% of Shopify’s TAM of $94 billion, as calculated above.
Figure 14: Revenue Growth Implied by Shopify’s Stock Price
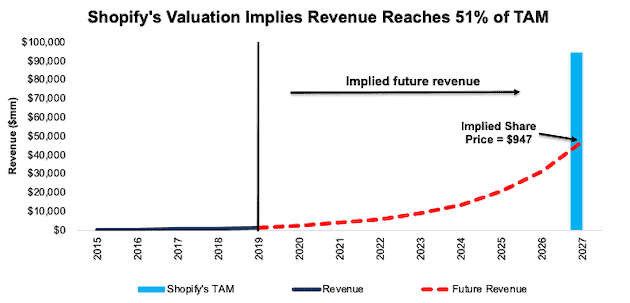
Sources: New Constructs, LLC and company filings.
While the revenue growth implied by the stock price is 51% of the projected TAM, the implied growth of the firm’s gross merchandise value (GMV), or value of all sales Shopify’s merchants generate on the firm’s platform, is even more astonishing. Last year, Shopify generated a total of $1.6 billion in revenue from a total of $61.1 billion of GMV – or $1 of revenue from every $38 of GMV. In the scenario outlined above, assuming the same revenue to GMV rate, the firm must generate $1.8 trillion in GMV in 2027 – or 30% of Grand View Research’s 2027 global B2C e-commerce market forecast of $6.2 trillion.
Per Figure 15, Shopify’s GMV in 2027 would be over 30 times the size of its 2019 GMV, over 20 times larger than eBay’s 2019 GMV, and five times bigger than Amazon’s.
Figure 15: GMV Growth Implied by Shopify’s Stock Price
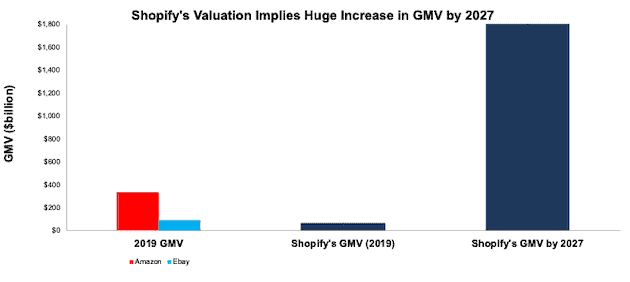
Sources: New Constructs, LLC and company filings.
Snap Inc. (SNAP) – Unattractive Rating
Read the entire report here: Priced to Take Over the World
We put Snap in the Danger Zone on September 14, 2020. Since then, stock is up ~6% (S&P 500 -2%). This short-term underperformance (as a short) looks unlikely given that SNAP is priced as if it will increase its daily active users (DAU) to equal nearly the entire world.
Doing the Math: Valuation Implies DAUs Must Nearly Equal All Humans
With slowing ARPU growth, heavy competition, already negative profitability, and ad rates falling across the industry, SNAP already looks risky. Below we provide more details on why this stock is too risky for fiduciaries.
First, Snap’s current economic book value, or no growth value, is -$13/share. But, let’s see what the price looks like if we give the firm credit for being able to grow into a profitable enterprise.
We’ll use our reverse DCF model to analyze the expectations implied by the current valuation.
To justify its current price of ~$24/share, Snap must immediately improve its NOPAT margin to 16% (compared to -53% TTM), which equals Twitter’s best-ever margin in 2018, and grow revenue by 30% compounded annually for the next eight years. See the math behind this reverse DCF scenario.
In this scenario, Snap would generate nearly $14 billion in revenue eight years from now, compared to $1.7 billion in 2019. At its 2Q20 ARPU ($1.91), this scenario implies the firm would have over 7.3 billion DAUs, which equals ~94% of the global population, and more than four times Facebook’s 2Q20 DAUs.
For comparison, if we optimistically assume Snap can increase its ARPU to $7.05 (equal to Facebook in 2Q20), then Snap needs just under 2 billion DAUs to achieve the revenue implied by its stock price. In other words, even if Snap can achieve the same ARPU as Facebook, it must have 11% more DAUs (eight years from now) than Facebook in 2Q20 to justify its current stock price. Figure 16 illustrates these expectations.
Figure 16: SNAP’s Valuation Implies Impossible Growth in DAUs
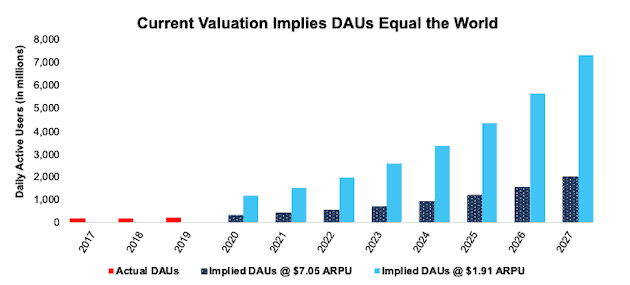
Sources: New Constructs, LLC and company filings.
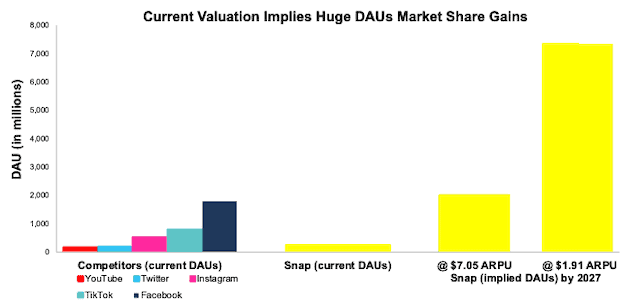
For comparison, we compare the DAUs implied by Snap’s stock price to some of its largest competitors, per Figure 17. At its current ARPU, Snap’s stock price implies it will have more DAUs than Facebook, TikTok, Instagram, Twitter, and YouTube combined (estimated ~3.4 billion, assuming no crossover between users).
Figure 17: SNAP’s Valuation Implies DAUs Will Dwarf Competition
Sources: New Constructs, LLC and company filings.
Peloton Interactive (PTON) – Unattractive Rating
Read the entire report here: Unfit for Fiduciaries
We put Peloton Interactive in the Danger Zone on September 21, 2020 and given the huge competition and overly optimistic expectations implied by its valuation, the stock holds significant downside risk.
Defining Peloton’s Addressable Market Size
Peloton estimates its household serviceable addressable market (SAM) for connected fitness equipment to be 15 million households. Peloton obtains this number from the number of households aged 18-70 with $50 thousand or more in household income who are interested in purchasing one or more of the firm’s products at current pricing. While we believe most households earning between $50 thousand to $100 thousand a year are more likely to meet their fitness needs with less expensive options, we nonetheless optimistically use Peloton’s number of 15 million households.
Assuming each household purchases one piece of equipment at a price of $2,495 (same as the starting prices of Bike+ and Tread), then Peloton’s SAM for connected fitness equipment is valued at ~$37.4 billion. Assuming the firm sells one subscription for each piece of connected fitness equipment sold, Peloton would generate an additional $7 billion in annual subscriptions. Peloton also estimates demand for its digital subscription offer of $12.99/month to be an additional five million households. Assuming each of these additional households purchase one digital subscription, Peloton would generate an additional $779 million in revenue. In total, Peloton’s SAM is valued at ~$45.2 billion.
With $1.8 billion of revenue in fiscal 2020, Peloton’s current share of its SAM is 4%. With the influx of competitors, such as Apple and Lululemon who already have established loyalty within much of Peloton’s SAM, Peloton will find gaining a greater share of its SAM increasingly difficult.
Peloton’s connected fitness equipment SAM of $37.4 billion is a very optimistic estimate. It is six times greater than Research and Markets’ 2020 valuation of the cardiovascular training segment (which includes bikes and treadmills) of the global fitness equipment market of $6.2 billion and 4.5 times greater than the $8.2 billion estimate for the same segment in 2027.
Doing the Math: PTON Is Priced to Capture 29% of Its SAM
Despite facing new and tough competition, Peloton is priced as if it will gain a large share of its estimated SAM.
To justify its current price of ~$90/share, Peloton must:
- Grow revenue at 32% (vs. consensus estimates of 96% in 2021, 35% in 2022, 31% in 2023, and 18% in 2024) compounded annually over the next seven years
- Immediately achieve a 13% (above Nautilus’ 16-year high of 10%) NOPAT margin
See the math behind this reverse DCF scenario. In this scenario, Peloton’s revenue in 2027 would reach $13 billion, or 29% of its SAM. In this scenario, Peloton grows NOPAT by 181% compounded annually for seven years and NOPAT in 2027 equals $1.7 billion, or three times Lululemon’s TTM NOPAT of $546 million and over 16 times Planet Fitness’ TTM NOPAT of $104 million.
Figure 18: Peloton Valuation Implies Unrealistic Revenue Growth
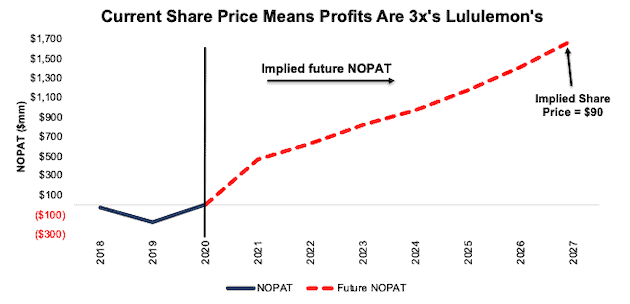
Sources: New Constructs, LLC and company filings.
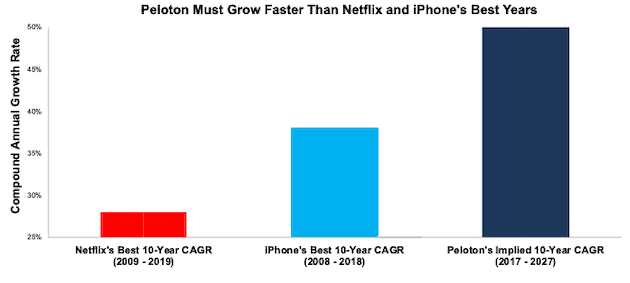
Peloton Is Valued to Outpace Netflix and the iPhone’s Peak Growth Years
To better illustrate the growth expectations implied by Pelton’s stock price, we compare the implied revenue growth from 2017 (the earliest year in the company’s IPO prospectus) to 2027 with the best 10-year-growth periods for Netflix (streaming services) and the iPhone (connected devices).
Netflix’s best 10-year-growth period, after it offered streaming services in 2007, is 2009 to 2019 with a 28% compounded annual revenue growth rate (CAGR). The iPhone’s best 10-year-growth period is 2008 to 2018 with a CAGR of 38%. Peloton’s current valuation implies the firm must grow its revenue by 50% compounded annually from 2017 to 2027, much higher than Netflix and iPhone in their best 10-year periods.
Figure 19: Peloton Valuation Implies Unrealistic Revenue Growth
Sources: New Constructs, LLC and company filings.
Stocks to Own Instead
Those with fiduciary duties need to examine the risk they take by owning any of the names mentioned above. On the flip side, we’ve identified several companies with strong underlying core earnings and valuations implying profits would never recover from COVID-induced lows. These stocks have not seen huge increases in their prices even though their cash flows are far superior to the companies above.
Our “See Through the Dip” thesis acknowledges that most of these firms’ profits are on the decline in the short term, however, their fundamentals and competitive advantages will enable them not just to survive the economic downturn, but also thrive in a recovery. These stocks provide excellent risk/reward and we expect them to outperform the crowded passive strategies over the long term.
Figure 20: See Through the Dip Stocks Vs. S&P 500 – Prices through September 22, 2020
Sources: New Constructs, LLC and company filings.
This article originally published on September 23, 2020.
Disclosure: David Trainer owns SYY, SPG, DHI, JPM, LUV, and H. Matt Shuler owns HFC. David Trainer, Kyle Guske II, and Matt Shuler receive no compensation to write about any specific stock, sector, style, or theme.
Follow us on Twitter, Facebook, LinkedIn, and StockTwits for real-time alerts on all our research.
[1] Note that Tesla’s stated goal for sales in 2020 is 500,000 vehicles.
[2] See vehicle sales stats for BMW from 2007-2019, for Lexus from 2018-2019, for Audi from 2005-2019 and for Mercedes from 2018-2019.
[3] *ASP calculated as automotive revenue / number of vehicles sold.