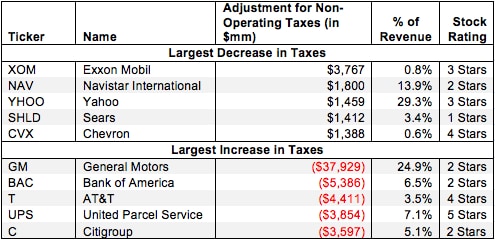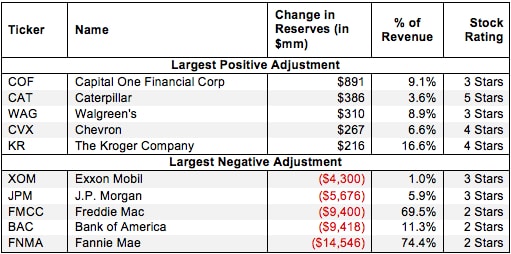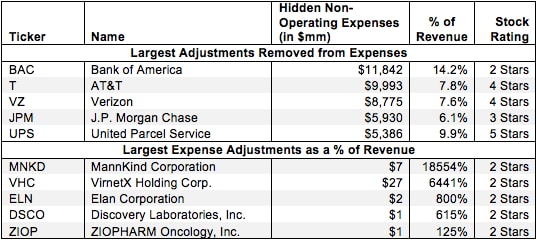
Value investing is a tried and tested approach that has worked wonders for investors in the past. However, in today's world, executing this strategy can be a daunting task, given the complexity of the annual reports that companies file. Even professional investors have a tough time understanding the profitability and valuation of companies due to the lengthy and convoluted filings they receive. With stocks becoming more volatile and earnings estimates less precise, investors could be misled into thinking they're making a wise investment when, in fact, there's another side to the coin they've not seen.
As regulators dole out punishments that fit the crimes, they are finally closing many of the illegal trading loopholes that have driven so much of Wall Street profits over the past decade.
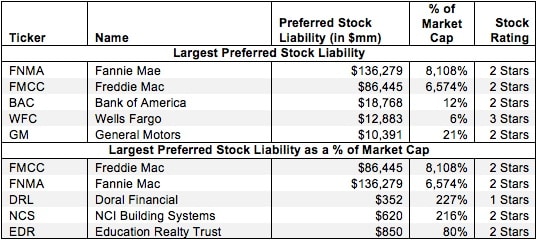
Preferred stock is a hybrid instrument that carries no voting rights but has a senior claim on assets and cash flows to common stock. Dividends usually must be paid out to preferred stock owners before common stock owners can receive any money. In the event of liquidation, preferred shareholders also have priority.
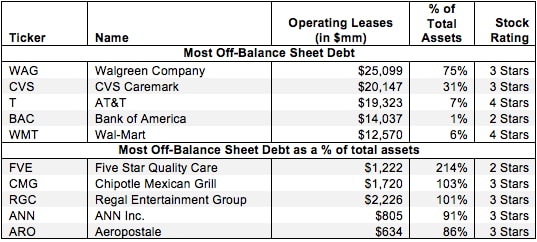
Investors who ignore off-balance sheet debt are not holding companies accountable for all of the capital invested in their business. By adding back off-balance sheet debt to invested capital, one can get a true picture of the value that management is creating for shareholders. Diligence pays.
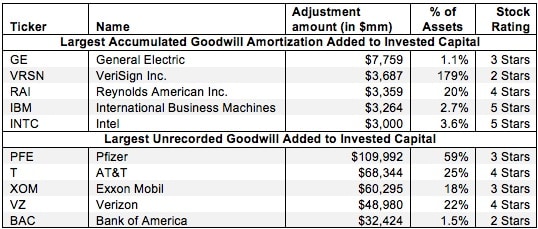
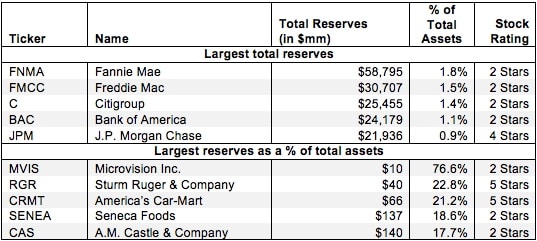
Reported assets don’t tell the whole story of the capital invested in a business. Accounting rules provide numerous loopholes that companies can exploit to hide issues and obscure the true amount of capital invested in a business over its life.
Reported earnings don’t tell the whole story of a company’s profits. They are based on accounting rules designed for debt investors, not equity investors, and are manipulated by companies to manage earnings. Only economic earnings provide a complete and unadulterated measure of profitability.
Non-operating expenses are unusual charges that don’t appear on the income statement because they are bundled in other line items. Without careful footnotes research, investors would never know that these non-recurring expenses distort GAAP numbers by lowering operating earnings.
The Large-cap Value style ranks second out of the twelve fund styles as detailed in my Style Rankings for ETFs and Mutual Funds report. It gets my Neutral rating, which is based on aggregation of ratings of 41 ETFs and 772 mutual funds in the Large-cap Value style as of May 1, 2013.
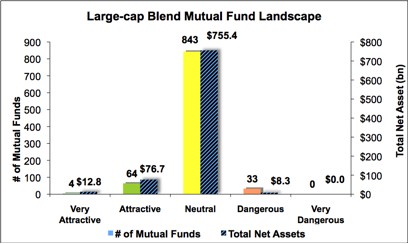
The large-cap blend style ranks first out of the twelve fund styles as detailed in my Style Rankings for ETFs and Mutual Funds report. It gets my Neutral rating, which is based on aggregation of ratings of 33 ETFs and 944 mutual funds in the large-cap blend style as of February 1st, 2013.
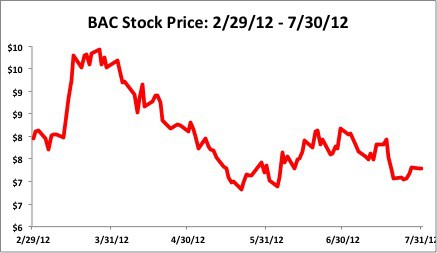
For the first time in many months, both Citigroup (C) and Bank Of America (BAC) are not on our Most Dangerous Stocks list as of the release of the August report.
The large-cap blend style ranks second out of the twelve fund styles as detailed in my style roadmap. It gets my Neutral rating, which is based on aggregation of ratings of 40 ETFs and 1127 mutual funds in the large-cap blend style as of July 17, 2012.
The large-cap blend style ranks first out of the twelve fund styles as detailed in my style roadmap. It gets my Neutral rating, which is based on aggregation of ratings of 40 ETFs and 1193 mutual funds in the large-cap blend style as of April 24, 2012.
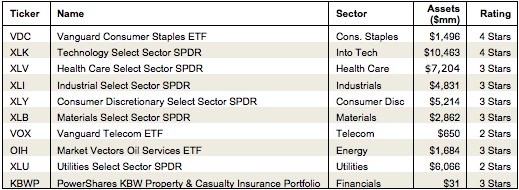
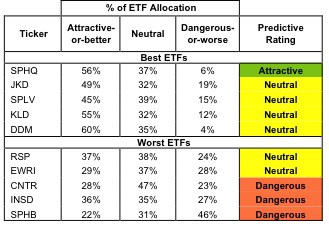
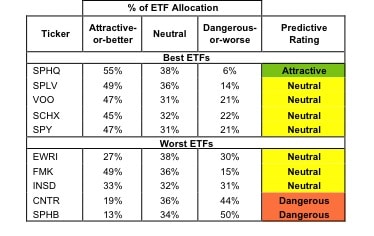
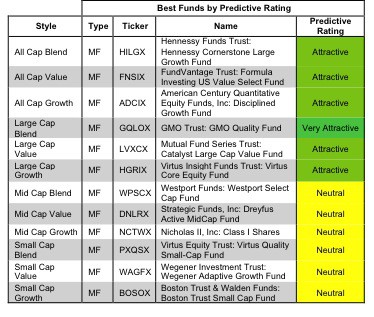
The best ETFs and mutual funds have high-quality holdings and low costs. As detailed in “A cheap fund is not always a good fund”, there are few funds that have both good holdings and low costs. While there are lots of cheap funds, there are very few with high-quality holdings.
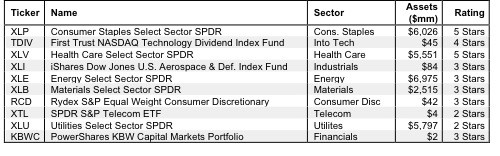
My ratings on ETFs are unique because they are based on my stock ratings for each of a fund’s holdings.
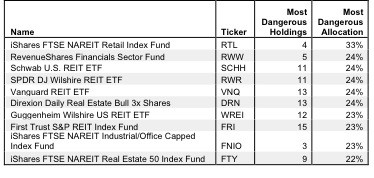
Ergo, the “Most Dangerous” ETFs allocate the most capital to stocks on March’s Most Dangerous Stocks list, which is available for non-subscribers as of today. There are 40 stocks on the Most Dangerous list every month.