
We closed the ZEN position on June 29, 2022. A copy of the associated Position Update report is here.
We published an update on the Pinterest Danger Zone pick on August 9, 2021. A copy of the associated Earnings Update report is here.
Check out this week’s Danger Zone interview with Chuck Jaffe of Money Life.
This week, we’re highlighting low-quality companies that look increasingly overvalued as market volatility rises. Given deteriorating fundamentals and lofty expectations baked into the stock prices, investors would be wise to avoid (or sell) these stocks. IQVIA Holdings (IQV: $138/share) and Zendesk, Inc. (ZEN: $73/share) are this week’s Danger Zone picks.
Weak Fundamentals Get Exposed in Market Downturns
Market corrections expose the risks of investing without a solid understanding of a company’s fundamentals and valuation.
Both ZEN and IQV witnessed a drop in share price alongside the market dip, but it’s not enough. These stocks could fall even further as investors sell low-quality overvalued stocks and seek refuge in strong, cash flow-generating businesses.
The fundamentals of these businesses have deteriorated since our original Danger Zone reports. They also share the following traits:
- Negative or low return on invested capital (ROIC)
- Declining core earnings
- More profitable competition
- Overly optimistic expectations baked into the stock price
As volatility rocks the market (recently reached highest level since 2011), investors would be wise to dump these risky stocks.
Zendesk, Inc (ZEN) – Unattractive Rating
In a bull market, easy access to capital allowed ZEN to invest heavily to compete with the giants of the tech world. As volatility increases and easy capital dries up, ZEN may struggle to keep up.
We first made Zendesk a Danger Zone pick in March 2018. Since then, the stock is up 58% while the S&P 500 is up 8%. However, ZEN’s fundamentals have only gotten worse, and the stock is down 20% during the recent market correction. This decline could be the beginning of a larger downturn should investors trim back exposure to profitless growth stocks.
ZEN has grown revenue by 45% compounded annually since 2014. Core earnings[1] have fallen from -$66 million in 2014 to -$161 million in 2019, per Figure 1. The firm’s ROIC fell from -14% in 2018 to -15% in 2019 and its -18% NOPAT margin is well below its competition. The firm is also burning through cash in its quest for growth, and has burned -$1.5 billion in free cash flow over the past five years.
Figure 1: ZEN’s Revenue & Core Earnings Since 2014
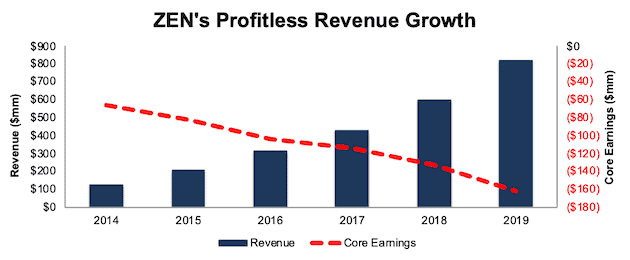
Sources: New Constructs, LLC and company filings
Economic Earnings Declining Faster Than Core Earnings
Core earnings account for unusual gains and expenses included in GAAP net income. To get the full picture of a company’s operations and hold management accountable for capital allocation, we also analyze balance sheets to calculate an accurate ROIC and economic earnings, the truest drivers of shareholder value.
Some notable adjustments to ZEN’s balance sheet include:
- Added $103 million in operating leases
- Added $2 million in accumulated asset write-downs
- Removed $1 million in other comprehensive income
After all adjustments, we find that ZEN’s economic earnings have worsened in each year since 2014 and have fallen from -$79 million in 2014 to -$244 million in 2019, per Figure 2. In other words, ZEN has failed to create true shareholder value despite rapidly growing its top line over the past few years.
Figure 2: ZEN’s GAAP Net Income, Core Earnings, and Economic Earnings Since 2014
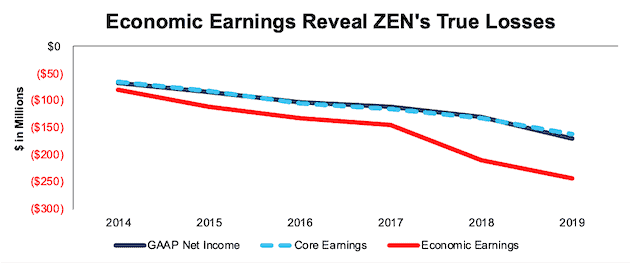
Sources: New Constructs, LLC and company filings
Shares Still Priced for Perfection
We believe the outperformance of ZEN since our initial report has been driven by noise traders myopically focused on top-line growth and non-GAAP metrics. When we remove the accounting distortions and look at the expectations implied by the stock price, ZEN appears significantly overvalued.
To justify its current price of $73/share, ZEN must immediately improve its NOPAT margin to 4% (compared to -18% in 2019), which equals salesforce.com’s (CRM) TTM NOPAT margin, and grow revenue by 30% compounded annually for the next 15 years. See the math behind this reverse DCF scenario. In this scenario, ZEN would be generating nearly $42 billion in revenue. For reference, Zendesk estimates its total addressable market is ~$25 billion. Furthermore, Mordor Intelligence estimates the customer engagement solutions market will grow by 13% compounded annually through 2025.
In other words, ZEN’s current valuation implies it will grow at more than double the rate of its industry and grow revenues to nearly two times the size of its addressable market.
For comparison, here’s another scenario. If we assume ZEN achieves a 15% NOPAT margin (average of competitors with positive margins in Figure 3) and grows revenue by 20% compounded annually for the next decade, the stock is worth only $46/share today – a 37% downside. See the math behind this reverse DCF scenario.
Each of the above scenarios also assumes ZEN is able to grow revenue, NOPAT and FCF without increasing working capital or fixed assets. This assumption is unlikely but allows us to create best-case scenarios that demonstrate how high expectations embedded in the current valuation are. For reference, ZEN’s invested capital has increased by an average of $179 million (22% of revenue in 2019) a year over the past five years.
Lagging Profitability Amongst Competitors
As noted in our original article, Zendesk faces competition from some of the largest tech firms in the world. Top competitors include salesforce.com, Oracle (ORCL), and Pegasystems (PEGA), each of which rank at or above Zendesk in Gartner’s 2019 Magic Quadrant for the Customer Engagement Center. Other competitors include Microsoft (MSFT), Nice Systems (NICE), ServiceNow (NOW) and more. Per Figure 3, Zendesk’s NOPAT margins rank below all listed competitors and its ROIC ranks below all but two competitors.
Figure 3: Zendesk’s Profitability Ranks Last Among Competition
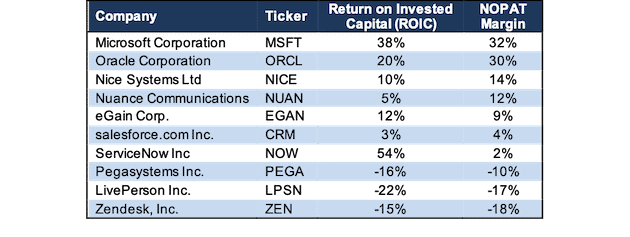
Sources: New Constructs, LLC and company filings
79% of ZEN’s customers are part of its Support and Chat products. Meanwhile, many of ZEN’s competitors offer customer engagement (chat/support/lead management/etc.) as part of a much larger suite of cloud and customer relationship management products. These profitable offerings provide competitors significant capital to invest in their business, expand their offerings, and increase sales & marketing efforts all while remaining profitable. Zendesk doesn’t have that luxury.
CRM, ORCL, PEGA, and MSFT spent $9.5 billion in sales & marketing in their last fiscal quarters. Zendesk spent $397 million in sales & marketing over the entirety of 2019. Burning cash instead of generating it puts Zendesk at a considerable competitive disadvantage especially if debt and stock markets continue to be volatile.
Management Not Accountable for Destroying Value
Making matters worse, for those that care about stewardship of capital, ZEN’s executive compensation plan allows management to earn bonuses and stock options with no accountability to shareholder value. In its latest proxy statement, ZEN disclosed executives’ annual bonuses are awarded based on these performance objectives: revenue growth, non-GAAP operating margin, and gross bookings.
Long-term incentives are provided in the form of stock options and restricted stock units, neither of which have a performance-based component. Instead, the options vest over a four-year period and incentivize executives to increase share price, no matter the long-term impact on the economics of the business.
The bottom line is that executives are incentivized by metrics that have allowed execs to earn bonus awards while destroying shareholder value. We’ve demonstrated through numerous case studies that ROIC, not non-GAAP net income or similar metrics, is the primary driver of shareholder value creation. Without a change in executive compensation, investors should expect more of the same value destruction.
IQVIA Holdings (IQV) – Unattractive Rating
We first made IQVIA a Danger Zone pick in May 2018. Since then, the stock is up 30% while the S&P 500 is up 8%. However, IQV’s fundamentals have only gotten worse, and the stock is down 16% during the recent market correction. This decline could be the beginning of a larger downturn as investors trim back exposure to low-quality businesses.
Since acquiring IMS Health and changing its name to IQVIA in 2016, IQV has grown revenue by 17% compounded annually. Core earnings have fallen by 15% compounded annually over the same time, per Figure 4. The firm’s NOPAT margin has fallen in each year since the acquisition and currently sits at just 6%, which is down from 8% in 2016. Over the same time, IQV’s ROIC fell from 10% to a bottom-quintile 3%.
Figure 4: IQV’s Revenue & Core Earnings Since 2016
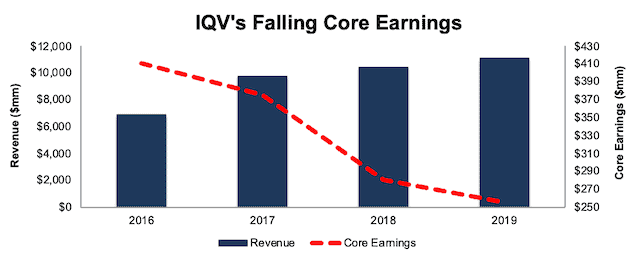
Sources: New Constructs, LLC and company filings
Economic Earnings Are Deteriorating Even Faster
We analyze balance sheets to calculate an accurate ROIC and economic earnings and made the following adjustments to IQV’s balance sheet:
- Added $531 million in operating leases
- Removed $348 million in excess cash
- Added $311 million in accumulated other comprehensive loss
- Removed $119 million in deferred tax assets
- Added $61 million in accumulated asset write-downs
After all adjustments, we find that IQV’s economic earnings fell from $254 million in 2016 to -$514 million in 2019, per Figure 5.
Figure 5: IQV’s GAAP Net Income, Core Earnings, and Economic Earnings Since 2016
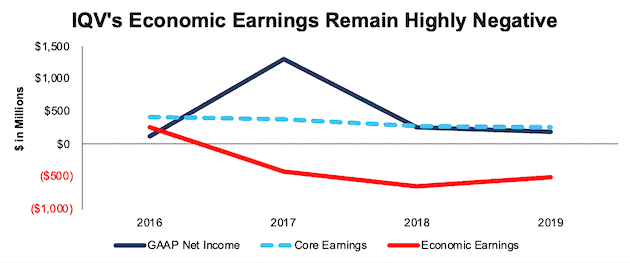
Sources: New Constructs, LLC and company filings
Shares Are Significantly Overvalued
IQV has outperformed the market since our original Danger Zone report, which we think is a byproduct of IQV’s rising non-GAAP “adjusted net income.” However, as detailed above, the firm’s true profits are in decline which leaves shares even more overvalued.
As volatility returns to the market, investors would be wise to avoid IQV, especially given the numerous, more profitable competitors available for purchase. Below, we use our reverse DCF model to quantify the expectations for future profit growth baked into IQV.
To justify its current price of $138/share, IQV must immediately improve NOPAT margins to 9% (compared to 6% in 2019), and grow NOPAT by 15% compounded annually for the next 10 years. See the math behind this reverse DCF scenario. This scenario assumes IQV can re-gain its NOPAT margin from before the Quintiles/IMS merger (despite declining each year since) and grow NOPAT at a CAGR (15%) that is three times faster than what it has achieved since the merger (5%).
Even if we optimistically assume IQV re-gains a 9% NOPAT margin and grows NOPAT by 13% compounded annually for the next decade, the stock is worth only $96/share today – a 30% downside. See the math behind this reverse DCF scenario. This scenario assumes IQV grows revenue at a CAGR of 8%, which equals the projected growth rate of the Contract Research Organization Services market.
Each of the above scenarios also assume IQV is able to grow revenue, NOPAT, and FCF without increasing working capital or fixed assets. This assumption is unlikely but allows us to create best-case scenarios that demonstrate how high expectations embedded in the current valuation are. For reference, IQV’s invested capital has increased by an average of $228 million a year for the past three years.
Lagging Profitability Amongst Competitors
While the Quintiles/IMS merger successfully created a larger company, it failed to create a more profitable one. In fact, just the opposite. IQV’s NOPAT margins and ROIC were higher in the years before the merger than they were in 2019.
More importantly, the merger opened up IQV to additional competition, in both the healthcare data and contract research organization markets. Per Figure 6, IQVIA’s NOPAT margin and ROIC rank below all publicly traded competitors listed in its 10-K.
Figure 6: IQV’s Low Profitability Limits Competitiveness
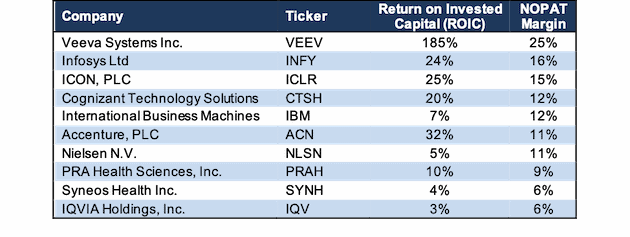
Sources: New Constructs, LLC and company filings
Going forward, some of the world’s most successful tech firms will put additional pressure on IQV. Alphabet, directly and through its subsidiaries is providing healthcare and life sciences data and analytics. Amazon, through its AWS Data Exchange, recently partnered with Deloitte to create a more efficient and secure healthcare data system. Apple, through its iPhones and Apple watches, helps institutions conduct healthcare studies using clinical trial participants, which can then be leveraged to better medical research and treatments.
Each of these firms are among the most experienced in data analytics, cloud software, and even machine learning and AI. Their ability to funnel resources (lots of cash and expertise) from other business lines into healthcare data analytics can drive down profitability across the industry as other firms lose pricing leverage and sacrifice margins to compete.
Management Still Not Accountable to Creating Shareholder Value
We criticized IQVIA’s executive compensation plan in our original report, and it’s no better now. Per the firm’s most recent proxy statement, short-term incentive awards are tied to revenue and adjusted EBITDA goals. Long-term incentive awards are tied to total stockholder return (TSR) and adjusted diluted EPS.
We’ve previously highlighted the problems with using adjusted EBITDA in executive compensation and none of the other metrics used in IQVIA’s plan are tied to true shareholder value creation. Three of the metrics, revenue, adjusted EBITDA, and adjusted EPS can be boosted through acquisitions or accounting loopholes that exclude real costs of the business. In addition, we’ve seen the pitfalls of tying executive compensation to TSR.
The bottom line here is that IQVIA’s executive compensation plan rewards executives while shareholder value is destroyed. Investors deserve better corporate governance.
The Importance of Fundamentals & Quantifying Expectations
In volatile markets like the one we’re in today, it pays to incorporate fundamentals into investment decision making. Fundamentals need not be 100% of your process, but they should not be 0%. And, if you’re relying on fundamentals at any level, it pays to make sure you have accurate fundamentals. Investors should not make decisions based on incomplete or less accurate data than what is available. Our Company Valuation Models incorporate all the data from financial filings to truly assess whether a firm is under or overvalued and get an accurate representation of the risk/reward of a stock. For ZEN and IQV, the risk/reward does not look good.
This article originally published on March 9, 2020.
Disclosure: David Trainer, Kyle Guske II, and Matt Shuler receive no compensation to write about any specific stock, sector, style, or theme.
Follow us on Twitter, Facebook, LinkedIn, and StockTwits for real-time alerts on all our research.
[1] Our core earnings are a superior measure of profits, as demonstrated in In Core Earnings: New Data & Evidence a paper by professors at Harvard Business School (HBS) & MIT Sloan. The paper empirically shows that our data is superior to IBES “Street Earnings”, owned by Blackstone (BX) and Thomson Reuters (TRI), and “Income Before Special Items” from Compustat, owned by S&P Global (SPGI).