We closed this position on November 18, 2020. A copy of the associated Position Update report is here.
Declining R&D productivity and rising costs are driving bio-pharma firms to increase the use of Contract Research Organizations (CROs). CROs represent a growing healthcare niche that benefits from significant barriers to entry and the trend towards outsourced R&D. Among public companies in the CRO space, this one earns our Very Attractive rating and leads the group in return on invested capital (ROIC), the key driver of shareholder value. ICON, Plc (ICLR: $90/share) is this week’s Long Idea.
Solid Revenue and Profit Growth (NOPAT)
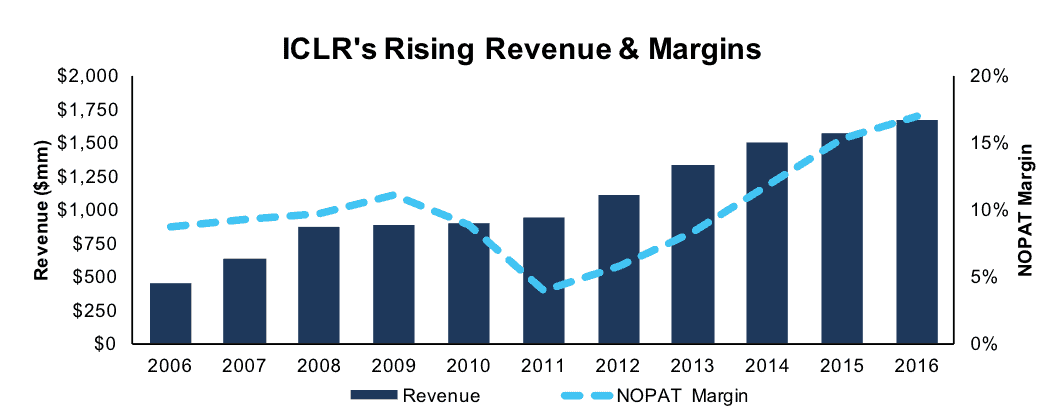
Over the past decade, ICLR has grown after-tax profit (NOPAT) by 22% compounded annually to $283 million in 2016. Revenues increased 14% compounded annually to $1.7 billion over the same period, while NOPAT margin increased to 17% in 2016 from 9% in 2006.
Over the past three years, revenue growth has moderated to 8% compounded annually. NOPAT growth, however, accelerated to 37% compounded annually due to more significant profit margin expansion. NOPAT margin increases averaged +3% per year over the last three years compared to the ten-year average of +1% per year. The NOPAT margin trend largely reflects prior year investments paying off through operating leverage, as well as the effective implementation of process optimization initiatives.
Figure 1: ICLR Revenue & NOPAT Margin
Sources: New Constructs, LLC and company filings
In addition to impressive revenue and NOPAT growth, free cash flow (FCF) generation has increased as well. Over the past five years, ICLR has generated $370 million of cumulative free cash flow, 9% of current market cap. 2016 FCF of $136 million increased from $18 million in 2012 and represented nearly 40% of the five-year total. ICLR’s current 3% free cash flow yield is in line with the average S&P 500 stock.
Rising Return On Invested Capital (ROIC)
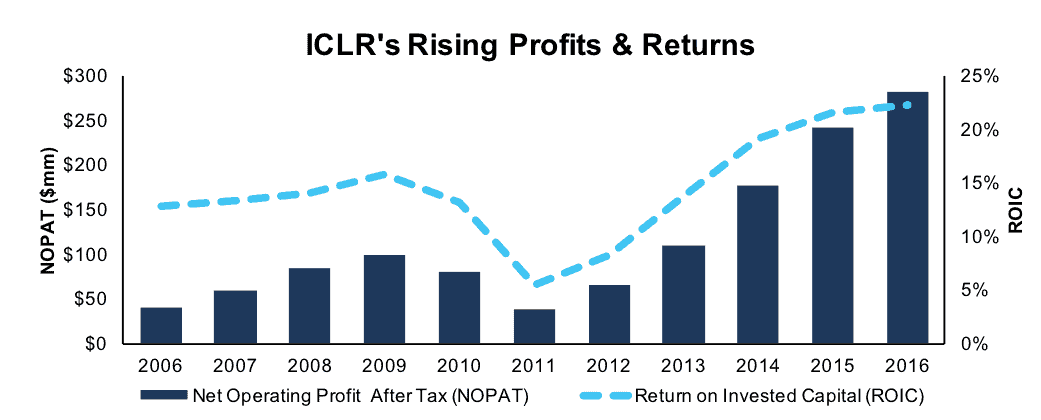
The company’s 22% ROIC is top-quintile among our coverage universe and is well above publicly-traded medical laboratory/research firms (median 8% ROIC) and the broader health care sector (median 4% ROIC). Prudent capital investment, steady revenue growth and expanding margins and have driven ROIC steadily higher each year since 2011 when ROIC bottomed at 5%. 2011 was a year where expense growth outpaced revenue growth by over 2:1. However, the investments ultimately paid off, and revenue growth has exceeded expense growth by nearly 2:1 since.
Figure 2: ICLR After-Tax Profit (NOPAT) and Return on Invested Capital (ROIC)
Sources: New Constructs, LLC and company filings
Improving ROIC Correlated with Increasing Shareholder Value
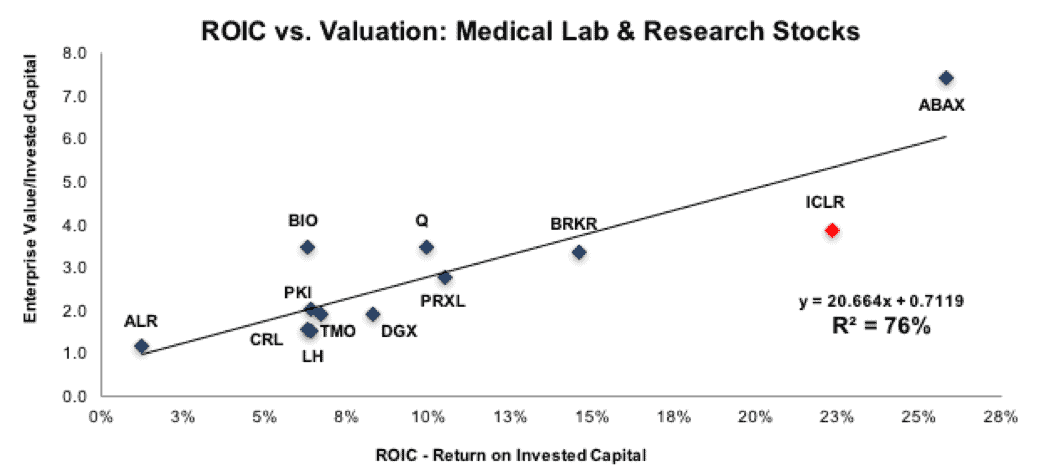
Per Figure 3, ROIC explains 76% of the valuation difference between ICLR and a peer group of twelve medical laboratory and research companies. Despite ICLR’s 22% ROIC, almost three times the peer median, the stock trades at a discount as shown by its position below the trend line in Figure 3. If ICLR traded at parity with the group, it would be $125/share – 39% above the current price. Given ICLR’s well above average ROIC, one would think the stock would garner a premium valuation.
Figure 3: ROIC Explains 76% of Valuation for Medical Lab and Research Stocks
Sources: New Constructs, LLC and company filings
Leading Profitability Reflects Competitive Advantages
The development process for a single new drug takes 10-15 years and can cost $2.6 billion, according to a 2014 Tufts University study. Accelerating the process by even a few months can help reduce costs and deliver additional revenue. Given this economic incentive, biopharmaceutical firms are increasingly outsourcing the R&D process to CROs, which do it more efficiently due to specialization and focus. The global CRO market was valued at roughly $25 billion in 2015, has experienced double-digit growth over the past decade and is projected to grow 8% annually to $45 billion by 2022. The market is highly concentrated with the top-10 firms controlling over 75% of the market.
Based on TTM data of public firms, ICLR is the fifth largest CRO with $1.7 billion of revenue behind Quintiles (Q; $7.7 billion), LabCorp (LH; $9.7 billion), PAREXEL (PRXL; $2.4 billion) and Charles River Laboratories (CRL: $1.8 billion). These firms compete on the basis of their capabilities, brand reputation and price. ICLR offers the full suite of planning, execution and analysis for Phase I to IV trials of the multi-national, several-thousand patient variety. Most importantly, CROs need a long and successful track record for bio-pharma firms to entrust them with a potential multi-billion-dollar asset. ICLR’s solid brand reputation is reflected in the 27-year relationship with Pfizer (PFE), its largest client.
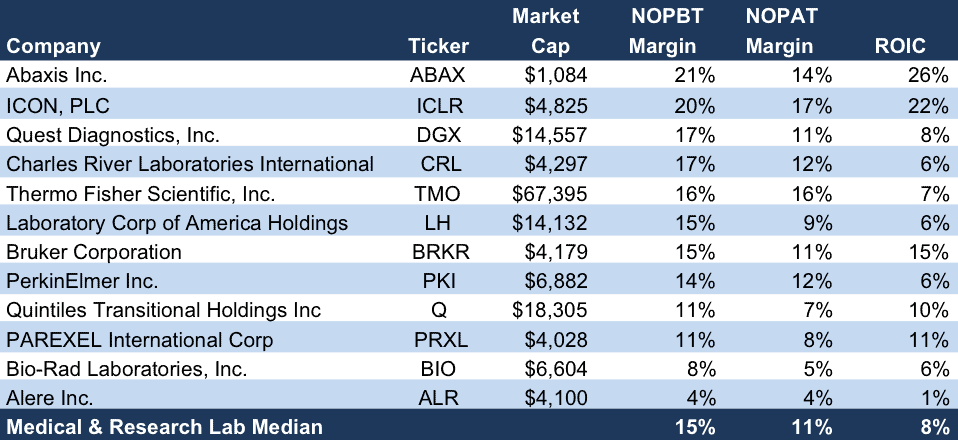
Per Figure 4, below, ICLR’s trailing twelve month (TTM) gross margin of 42% is below the CRO peer group of 53%. This makes ICLR’s 20% pre-tax operating profit margin (NOPBT) even more impressive when compared against CRO peers at 13%, reflecting a lean cost structure and better operational efficiency. We utilized NOPBT margin for operational efficiency comparisons given that being domiciled in Ireland represents a clear tax advantage for ICLR. These operational and tax advantages should result in ICLR being better able to absorb competitive pricing pressure or demand swings, while at the same time providing more flexibility to invest for the future without sacrificing its ROIC advantage.
Figure 4: ICLR Profit Margins (TTM) and ROIC vs. Medical Laboratory & Research Peers
Sources: New Constructs, LLC and company filings
Bear Case Risks: Bio-Pharma R&D Budgets, Customer Concentration
Historically, the main risk to ICLR profitability has been demand swings caused by changes in R&D spending rates among global bio-pharma firms. This risk was apparent during the 2009-2011 timeframe, when ICLR’s revenue growth slowed to 3% compounded annually while continued investment in the firm caused profitability to contract. We think the risk to ICLR’s profitability from a global R&D slowdown is lower today for several reasons: 1) the trends towards R&D outsourcing and strategic CRO partnerships were less established; 2) ICLR was more dependent on “project by project” vs. long-term contracted revenue; and 3) ICLR does not require the same level of investment as before.
Another risk cited against ICLR is customer concentration. ICLR’s Top 25 clients accounted for 75% of revenue in 2016, with Pfizer (PFE) accounting for 26%. We think the Pfizer (PFE) risk is mitigated by the relationship’s 27-year history and a recently renewed 5- to 7-year contract. Further, the company expects to reduce PFE’s revenue concentration to 15-17% during 2017. Generating positive revenue growth in 2017 (+3% consensus) while meaningfully reducing single-customer risk would be a long-term positive.
Valuation Implies Low Profit Growth Expectations
At the current price of $90/share, ICLR has a price-to-economic book value ratio (PEBV) of 1.1. This ratio means the market expects ICLR’s NOPAT to grow no more than 10% over the remainder of its corporate life. This expectation seems overly pessimistic for a company that has grown NOPAT by 22% compounded annually over the past decade and whose industry is projected to grow at least 8% annually through 2022.
If ICLR can maintain NOPAT margins of at least 15% (below TTM margins of 17%) and grow NOPAT by just 3% compounded annually over the next ten years, the stock is worth $107 today – 19% above the current price. This scenario assumes ICLR will grow revenues by consensus in 2017 (3%) and 2018 (5%) and 4% compounded annually thereafter. For reference, ICLR has grown revenue (compounded annually) by 8%, 12% and 14%, respectively, over the past three, five and ten-year periods.
No Dividend; But Buybacks Yield 6%
Dividends are uncommon among medical laboratory/ research stocks and non-existent among CROs. Achieving growth rather than becoming a cash cow is the focus of these firms given the market opportunity.
ICLR has had an active repurchase program for the past two years. The company has spent $570 million repurchasing 6.3 million shares, a 10% reduction in outstanding shares. The company had $290 million remaining under its authorization as of its last public filing (12/31/16). The remaining repurchase authorization equates to 3.4 million shares at current prices (6% of outstanding) and 6% of the current market cap. Such repurchase activity would provide a potential buyback yield of 6% if the remaining authorization was executed between now and 12/31/17.
Potential Catalysts: Strategic Partnerships, Acquisitions, Margin Expansion
Strategic partnerships between bio-pharma firms and CROs represent an important, emerging trend. Roughly half of all bio-pharma firms have entered into such partnerships with a small number of “preferred providers,” usually between 1-5 CROs. This trend is expected to drive M&A consolidation, bolster the competitive position of market leaders and result in more long-term contracted revenue and less “project by project” revenue for CROs. ICLR is well positioned to benefit from this trend due to its strong brand reputation.
The industry’s high regulatory burden and high capital investment requirements represent significant barriers to entry and an operational challenge to smaller firms. During 2007-2012, an estimated 45% of small- and mid-sized CRO’s were acquired or shut down, making small acquisitions and asset purchases by larger firms common. Management has indicated the company will continue to pursue small, synergistic acquisitions supported by cash flows (i.e. cash and debt vs. equity issuance), a strategy that appears to have benefited shareholders over the last five years given ICLR’s increasing ROIC.
We think ICLR remains positioned to grow revenue faster than expenses given the ongoing maturation of past investments and the likelihood that ICLR will continue to win its share of new business coming from increased outsourcing. Biopharma firms spent an estimated $145 billion on R&D in 2016, while the CRO viable portion is estimated at $75 billion. The actual 2016 CRO market approximated $30 billion while the TTM revenue of the five largest publicly traded CROs (per Figure 4) was approximately $23 billion. With over half of the viable market currently unaddressed by CROs, the growth outlook for strong brands looks bright.
We are comfortable assuming that a combination of the three factors outlined above will drive revenue and profit growth above the low expectations currently embedded in the valuation, resulting in a favorable risk/reward trade-off.
Executive Comp Likely Could be More Shareholder Aligned
As a “foreign private issuer,” ICLR is not required to provide a “say on pay” shareholder resolution in the annual proxy statement and details on incentive targets are unavailable. The most recent annual report indicated executive comp is targeted based on other healthcare/bio-pharma/CRO firms of similar market cap, adjusted for individual performance, experience and level of responsibility. This plan could be better aligned with shareholders by tying management compensation directly to ROIC.
We know from Figure 3 above, and multiple case studies, that ROIC is directly correlated to changes in shareholder value. Use of ROIC to measure performance ensures executives’ interests are aligned with shareholder’s interests. In the case of ICLR, there has been no profiting from misleading metrics while shareholder value is destroyed. Over the past 10 years, economic earnings have grown from $13 million to $212 million (32% annually), a clear indication of shareholder value creation.
Insider Trading and Short Interest
There is little insight to be gained from recent insiders or short seller trends. Insiders own 4.0% of the company but have not engaged in any material insider buying or selling over the past 90 days. There are currently 2.2 million shares sold short equating to 4% of shares outstanding and 4 days to cover. Short interest is up 12% (roughly 235,000 shares) since year end but is only up 8% (162,000 shares) from a year ago.
Footnotes Adjustments and Forensic Accounting
Our Robo-Analyst technology enables us to perform forensic accounting with scale and provide the research needed to fulfill fiduciary duties. In order to derive the true recurring cash flows, an accurate invested capital, and an accurate shareholder value, we made the following adjustments to ICLR’s 2016 10-K:
Income Statement: we made $37 million of adjustments, with a net effect of removing $21 million in non-operating expense (1% of revenue). We removed $8 million in non-operating income and $29 million in non-operating expenses. You can see all the adjustments made to ICLR’s income statement here.
Balance Sheet: we made $510 million of adjustments to calculate invested capital with a net decrease of $62 million. The largest adjustment was $127 million due to operating leases. This adjustment represented 10% of reported net assets. You can see all the adjustments made to ICLR’s balance sheet here.
Valuation: we made $726 million of adjustments with a net effect of decreasing shareholder value by $372 million. Apart from total debt of $476 million, which includes $127 million of operating leases noted above, the largest adjustment was $65 million for the fair value of outstanding stock options. This adjustment represents 4% of ICLR’s market cap.
Attractive Funds that Hold ICLR
The following funds receive our Attractive-or-better rating and allocate significantly to ICLR.
- Knights of Columbus Large Cap Value Fund (KCVSX) – 4.2% allocation and an Attractive rating.
- Archer Stock Fund (ARSKX) – 2.5% allocation and an Attractive rating.
This article originally published on May 22, 2017.
Disclosure: David Trainer, Kyle Guske II and Kenneth James receive no compensation to write about any specific stock, style, or theme.
Follow us on Twitter, Facebook, LinkedIn, and StockTwits for real-time alerts on all our research.
Click here to download a PDF of this report.
Photo Credit: Nick Ares (Flickr)


