
We closed this position on July 19, 2018. A copy of the associated Position Update report is here.
It can be easy to write-off an entire industry, such as retail, when headlines consistently predict a downfall. However, a downtrodden industry often contains hidden gems that can only be found through real due diligence. Despite slowing store traffic across the industry, this market leader is consistently improving profitability and creating shareholder value. With a growing e-commerce presence, we believe the firm can continue to outperform. Carter’s Inc. (CRI: $88/share) is this week’s Long Idea.
Carters’ Impressive Profit Growth
Since 2003, Carter’s has grown (NOPAT) by 16% compounded annually to $309 million in 2016, per Figure 1. The company’s NOPAT margin has improved from 7% in 2011, to 10% in 2016.
Figure 1: Carters’ NOPAT Growth Since 2003
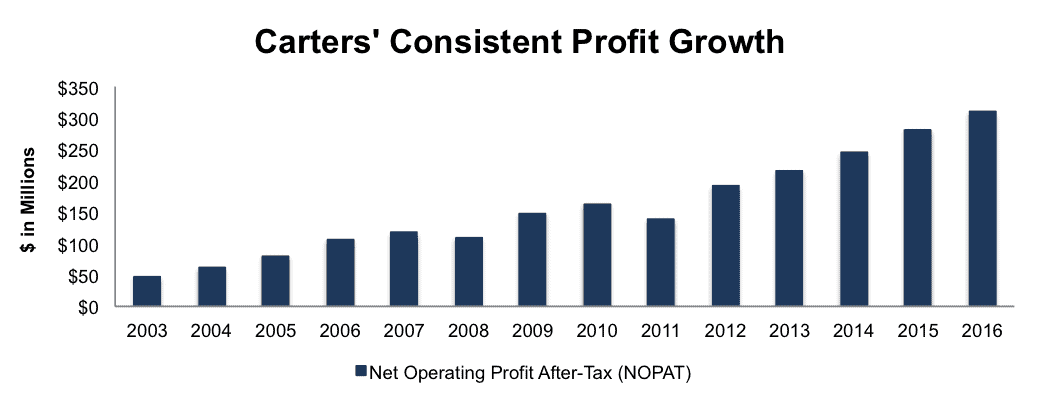
Sources: New Constructs, LLC and company filings
In addition to NOPAT growth, Carter’s has generated a cumulative $333 million (8% of market cap) in free cash flow (FCF) over the past five years. Carter’s has also exhibited good stewardship of capital and has improved its return on invested capital (ROIC) from 9% in 2011 to 12% in 2016, per Figure 2.
Figure 2: Improvements In Carters’ ROIC
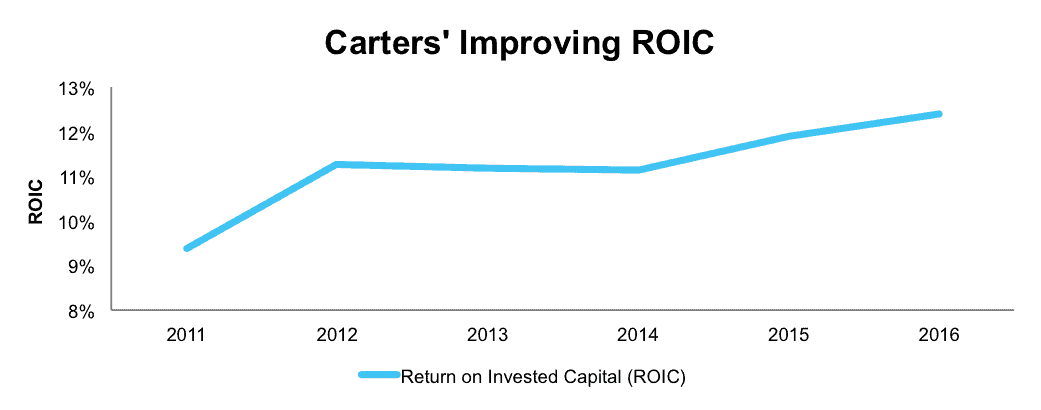
Sources: New Constructs, LLC and company filings
Improving ROIC Correlated With Creating Shareholder Value
Per Figure 3, ROIC explains 55% of the changes in valuation for the 15 retail firms in Carter’s peer group. Despite Carters’ 12% ROIC, above the 10% average of the peer group, the firm’s stock trades at a discount to peers as shown by its position below the trend line in Figure 3. Given the firm’s consistently high ROIC, profit growth, and improving margins, one would think the stock would garner a premium valuation.
Figure 3: ROIC Explains 55% Of Valuation for CRI Peers
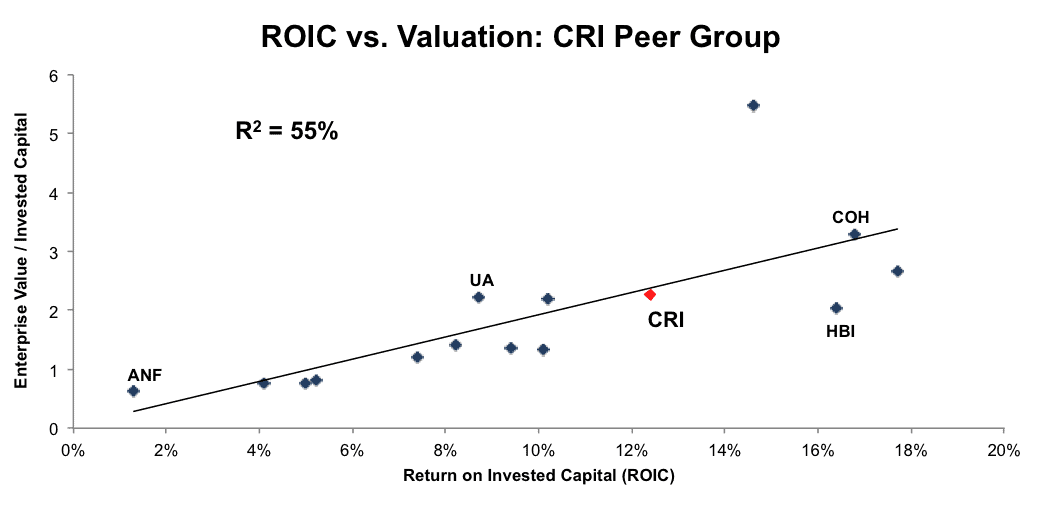
Sources: New Constructs, LLC and company filings
High Profitability Gives Carter’s A Competitive Advantage
In the retail industry, margins are the biggest source of a firm’s competitive advantage. High margins allow a firm to cut prices in response to competition and still remain profitable. At the same time, higher margins allow firms to better withstand economic downturns and invest in growth during strong economic cycles. Per Figure 4, Carter’s has one of the top ROIC’s and margins versus peers, which include Hanesbrands (HBI), Children’s Place (PLCE), and The Gap’s (GAP) Old Navy and Gap.
As seen above, high margins allowed Carter’s to remain profitable during the 2008/2009 recession and grow profits as the economy improved. Additionally, Carter’s profitability gives it the ability to place pressure on lower margin competitors (through discounts or increased ad spending) and grow its already leading market share.
Figure 4: Carters’ Profitability Leads Nearly All Peers
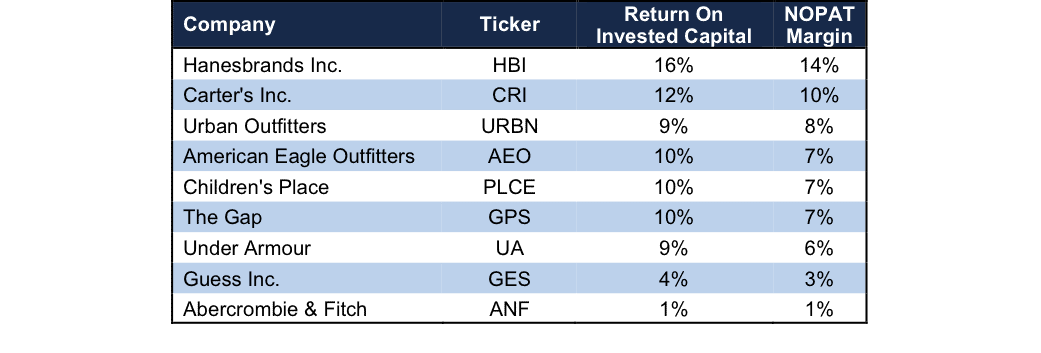
Sources: New Constructs, LLC and company filings.
Bear Concerns Ignore Carters’ Multi Channel Success
Pundits have been calling for the downfall of traditional retailers for years now, as consumers increasingly shop online. In some cases, these pundits have been spot on, with firms such as Sears (SHLD), Macy’s (M), and J.C. Penney (JCP) struggling to attract foot-traffic and subsequently closing numerous stores. CRI bears will tout these (and other) industry failings as reason to discount Carters’ future potential. However, the bear case ignores Carters’ multi-channel retail model, leading market share, and its rapid e-commerce growth.
Carter’s operates a multi-channel sales model, whereby its products are sold in its own retail stores, large national retailers, and online. Additionally, the firm provides private brands for Walmart (WMT) and Target (TGT). The key to this multi-channel model is Carter’s success is not solely reliant upon building and occupying its own retail locations, which is capital intensive and can diminish margins. It’s products are sold in 18,000 wholesale locations in the U.S., which include department stores, chain stores, and discount retailers such as Costco (COST), Kohl’s (KSS), and Toys “R” Us. In 2016, the wholesale segment accounted for 37% of revenue. The threat of a large national chain opening a new store and taking share from Carters’ own stores is minimized as its products are already sold in the chain stores.
The diversification in point of sale has allowed Carter’s to continually grow sales and market share despite decreased store traffic. Per Figure 5, Carters’ share of the baby and young children’s apparel market has grown from 16.1% in 2013 to 17.8%. According to the NPD Group, Carter’s has the largest share of this market and more than twice the share of the nearest competitor. Carter’s has even larger shares of individual subsets of the apparel category, including 25% share in the baby market ages zero to two and 32% share in sleepwear.
Figure 5: Carters’ Growing Market Share

Sources: New Constructs, LLC and company filings.
Key to long-term success, Carter’s has developed a successful e-commerce platform to keep up with shopping preferences. In 2016, Carter’s e-commerce sales grew 24% year over year, the fourth consecutive year of double-digit growth, to nearly $500 million (16% of revenue). In the 4Q16 earnings conference call, management noted, “e-commerce is the firm’s fastest growing and highest margin business.”
The firm’s e-commerce success is strong enough to make it “the second largest contributor to the growth in online sales of young children’s apparel in 2016, second only to Amazon” according to the firm’s 4Q16 conference call and NPD market data.
Rather than attempt to fight Amazon, the company established a direct relationship with Amazon in 2016. Carter’s began selling different variations of its existing products on Amazon and expects to build on this relationship in 2017.
Carters’ valuation also undermines any bear argument. Despite rising sales, impressive e-commerce growth, and continued profitability, CRI’s current valuation implies permanent profit decline, as we’ll show below.
Valuation Implies Significant Decline In Profits
CRI is up 3% year-to-date while the S&P is up 5%, and shares are undervalued. At its current price of $88/share, CRI has a price-to-economic book value (PEBV) ratio of 0.8. This ratio means the market expects Carters’ NOPAT to permanently decline by 20%. This expectation seems rather pessimistic for a firm that has grown NOPAT by 11% compounded annually for the past decade.
Even if CRI were to never again grow profits from current levels, the economic book value, or no growth value of the firm is $109/share – a 24% upside from current valuation.
If Carter’s can maintain 2016 NOPAT margins of 10% and grow NOPAT by 5% compounded annually for the next decade, the stock is worth $151/share today – a 72% upside. This scenario assumes CRI can grow revenue by consensus estimates in 2017 (5.2%) and 2018 (5.1%), and 5% each year thereafter. Given the company’s international expansion, new store openings, and e-commerce success, CRI could easily meet or even surpass these expectations. Add in the 1.7% dividend yield and its clear why investors overlooking CRI may be missing an excellent portfolio addition.
Buy Back Plus Dividend Could Yield Nearly 7%
In 2016, Carter’s repurchased over $300 million worth of stock, up from $110 million in 2015. At the end of 2016, the company had $275 million remaining under its current authorization. If Carter’s were to average its 2015 and 2016 repurchase activity, the remaining authorization will last just over one year, and the firm would repurchase a total of $205 million this year. A repurchase of this size is 4.8% of the current market cap. When combined, Carters’ 4.8% repurchase yield and 1.7% dividend yield offer investors a total potential yield of 6.5%
CRI’s International Expansion Could Drive Shares Higher
In 2016, international sales represented 11% of total revenue, with Canada representing two-thirds of international sales. Carter’s holds a leading position with 19% of the Canadian market and plans to open 50 stores over the next five years. Apart from Canada, Carter’s is looking to China to stoke further revenue growth. 2016 was the first full year of sales on T-Mall, an Alibaba (BABA) website and the firm entered a deal with its first Chinese wholesaler, Pou Sheng. According to management, the Chinese market is expected to double by 2025, which could provide a significant boost in revenue.
Domestically, Carter’s is focused on opening more productive and profitable stores, while moving away from outlet malls. Through a smaller, co-branded layout, Carter’s can sell both its brands (babies and young children) in one location while keeping costs to a minimum. These efforts help Carter’s maintain its leading margins and exceed the market’s low expectations for future cash flows.
Beating both top and bottom line expectations could be the catalyst that pushes the stock higher. When Carter’s reported 4Q15 results above consensus, the stock rose 16% over the following week. In 4Q16, when Carter’s beat both top and bottom line consensus estimates, the stock rose 8% in the following two days.
With new initiatives such as the co-branded stores, international expansion, and improved e-commerce technology, CRI could be poised for another beat and subsequent increase in valuation. In the meantime, investors in this stock carry very low valuation risk and are rewarded with a potential 6.5% yield when combining the 1.7% dividend yield with the 4.8% share repurchase yield.
Executive Compensation Plan Could Be Improved, But Raises No Alarms
Carters’ executive compensation plan, which includes base salary, annual cash incentives, and long-term stock units, is largely tied to multiple metrics. Annual bonuses are awarded by achieving target net sales, adjusted EBIT, and adjusted EPS goals. Long-term performance-based shares are awarded for achieving EPS growth targets over a three-year period. We would prefer to see executive compensation tied to ROIC, since there is a strong correlation between ROIC and shareholder value, However, CRI’s current exec comp plan has not led to executives getting paid while destroying shareholder value. In fact, over the past decade, Carters’ economic earnings, the true cash flows of the business, have grown from $26 million to $198 million, a clear creation of shareholder value.
Insider Trends Minimal While Short Interest Highlights Market Pessimism
Over the past 12 months, insiders have purchased 103 thousand shares and sold 135 thousand shares for a net effect of 32 thousand insider shares sold. These sales represent less than 1% of shares outstanding. Additionally, short interest sits at 4.8 million shares, or 10% of shares outstanding. It would appear the market is buying into the retail fears despite Carters’ track record of profitability.
Impact of Footnotes Adjustments and Forensic Accounting
Our robo-analyst technology enables us to perform forensic accounting with scale and provide the research needed to fulfill fiduciary duties. In order to derive the true recurring cash flows, an accurate invested capital, and an accurate shareholder value, we made the following adjustments to Carters’ 2016 10-K:
Income Statement: we made $119 million of adjustments, with a net effect of removing $53 million in non-operating expense (2% of revenue). We removed $33 million in non-operating income and $86 million in non-operating expenses. You can see all the adjustments made to CRI’s income statement here.
Balance Sheet: we made $1.3 billion of adjustments to calculate invested capital with a net increase of $823 million. The largest adjustment was $902 million due to operating leases. This adjustment represented 54% of reported net assets. You can see all the adjustments made to CRI’s balance sheet here.
Valuation: we made $1.8 billion of adjustments with a net effect of decreasing shareholder value by $1.5 billion. Apart from total debt, which includes the operating leases noted above, one of the notable adjustments was $152 million in excess cash. This adjustment represents 4% of Carters’ market cap. Despite the net decrease in shareholder value, CRI remains undervalued.
Attractive Funds That Hold CRI
The following funds receive our Attractive-or-better rating and allocate significantly to Carter’s.
- PFS Funds: Bretton Fund (BRTNX) – 3.9% allocation and Very Attractive rating
- Congress Mid Cap Growth Fund (IMIDX) – 2.2% allocation and Attractive rating
- Nationwide Geneva Mid Cap Growth Fund (NWKAX) – 1.7% allocation and Attractive rating.
This article originally published on April 10, 2017.
Disclosure: David Trainer and Kyle Guske II receive no compensation to write about any specific stock, style, or theme.
Follow us on Twitter, Facebook, LinkedIn, and StockTwits for real-time alerts on all our research.
Click here to download a PDF of this report.
Photo Credit: Eivind Sandstad (Flickr)
1 Response to "Undervalued Retailer With Nearly 7% Yield"
Let me guess, Barnes & Noble?
If someone else receives this, would you send David a message for me – tell him Emma says hello.
Hope the team over at New Constructs is doing well. Nice call on Palo Alto Networks, by the way.