
Our report, S&P 500 & Sectors: ROIC vs. WACC Through 2Q21, reveals the return on invested capital (ROIC) for the S&P 500 rebounded strongly through the first half of 2021. This report takes a closer look at the risk/reward for S&P 500 companies with high ROICs.
Our research is based on the latest audited financial data, which is the calendar 2Q21 10-Q for most companies. More free reports on the fundamental trends for the overall market and each sector are available here. Pro and higher members get all of our reports on fundamental market and sector trends.
All of our reports leverage more reliable fundamental data[1] that overcomes flaws with legacy fundamental datasets. Our Earnings Distortion factor generates substantial idiosyncratic alpha.
S&P 500 ROIC Continues to Rebound in 2Q21
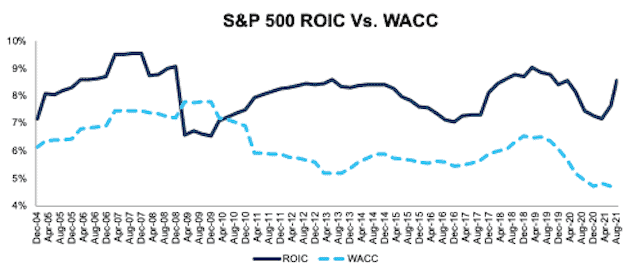
After the COVID-19 pandemic caused ROIC to fall throughout 2020, the S&P 500’s ROIC sharply recovered in 1H21 to pre-pandemic levels.
Figure 1 shows the S&P 500’s ROIC rose from 7.4% in 2Q20 to 8.6% in 2Q21. The S&P 500’s NOPAT margin rose from 10.8% in 2Q20 to 11.9% in 2Q21, while invested capital turns rose from 0.69 to 0.72 over the same time.
Figure 1: ROIC and WACC for the S&P 500 From December 2004 – 8/18/21[2]
Sources: New Constructs, LLC and company filings.
The August 18, 2021 measurement period uses price data as of that date and incorporates the financial data from 2Q21 10-Qs, as this is the earliest date for which all the 2Q21 10-Qs for the S&P 500 constituents were available.
Good Companies (High ROIC) & Good Stocks (Cheap Valuation)
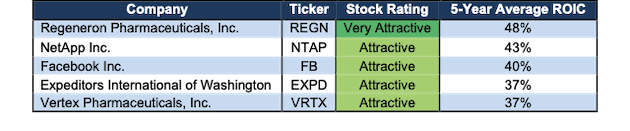
We leverage our more reliable fundamental data to identify the most profitable S&P 500 businesses whose stocks present attractive risk/reward. Figure 2 shows the five S&P 500 firms with the highest five-year average ROICs[3] and Attractive-or-better Overall Risk/Reward ratings.
Figure 2: S&P 500 Companies with High 5-year Average ROIC and Attractive-or-Better Ratings: TTM
Sources: New Constructs, LLC and company filings.
Regeneron (REGN): a Quality Company Priced for Permanent Profit Decline
Not only does Regeneron operate a very profitable business, but its valuation implies that its profits will permanently decline from current levels. The combination of strong, growing profitability and low expectations creates an investment opportunity with favorable risk/reward.
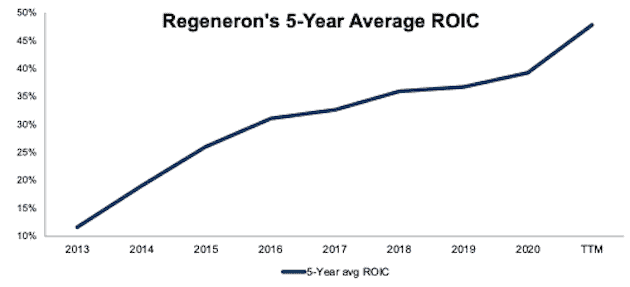
Regeneron’s Rising ROIC: While some investors may assume Regeneron’s current profitability is the result of a short-term benefit from the COVID-19 pandemic, its five-year average ROIC reveals the firm has steadily improved its profitability well before 2020. Per, Figure 3, Regeneron’s five-year average ROIC rose from 12% in 2013 to 48% over the trailing twelve months (TTM).
Figure 3: Regeneron’s Five-Year Average ROIC: 2013 – TTM
Sources: New Constructs, LLC and company filings.
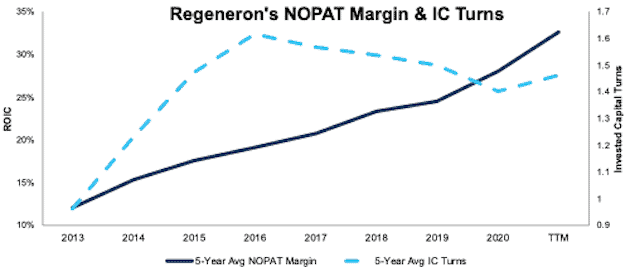
Rising Margins and Invested Capital Turns Drive ROIC: Figure 4 shows that rising five-year average net operating profit after tax (NOPAT) margin[4] (a measure of operational efficiency) and five-year average invested capital turns[5] (a measure of capital/balance sheet efficiency) over the TTM drive the firm’s ROIC higher. The firm’s five-year NOPAT Margin rose from 12% in 2013 to 33% TTM, while its five-year average invested capital turns improved from 1.0 to 1.7 over the same time.
Figure 4: Regeneron’s Five-Year Average NOPAT Margin and IC Turns: 2013 – TTM
Sources: New Constructs, LLC and company filings
REGN Is Priced for Permanent Profit Decline: Regeneron’s price-to-economic book value (PEBV) ratio of 0.5 implies that the market expects Regeneron’s NOPAT will permanently decline by 50%. This expectation seems rather pessimistic for a firm that has grown NOPAT by 33% compounded annually from 2015-2020.
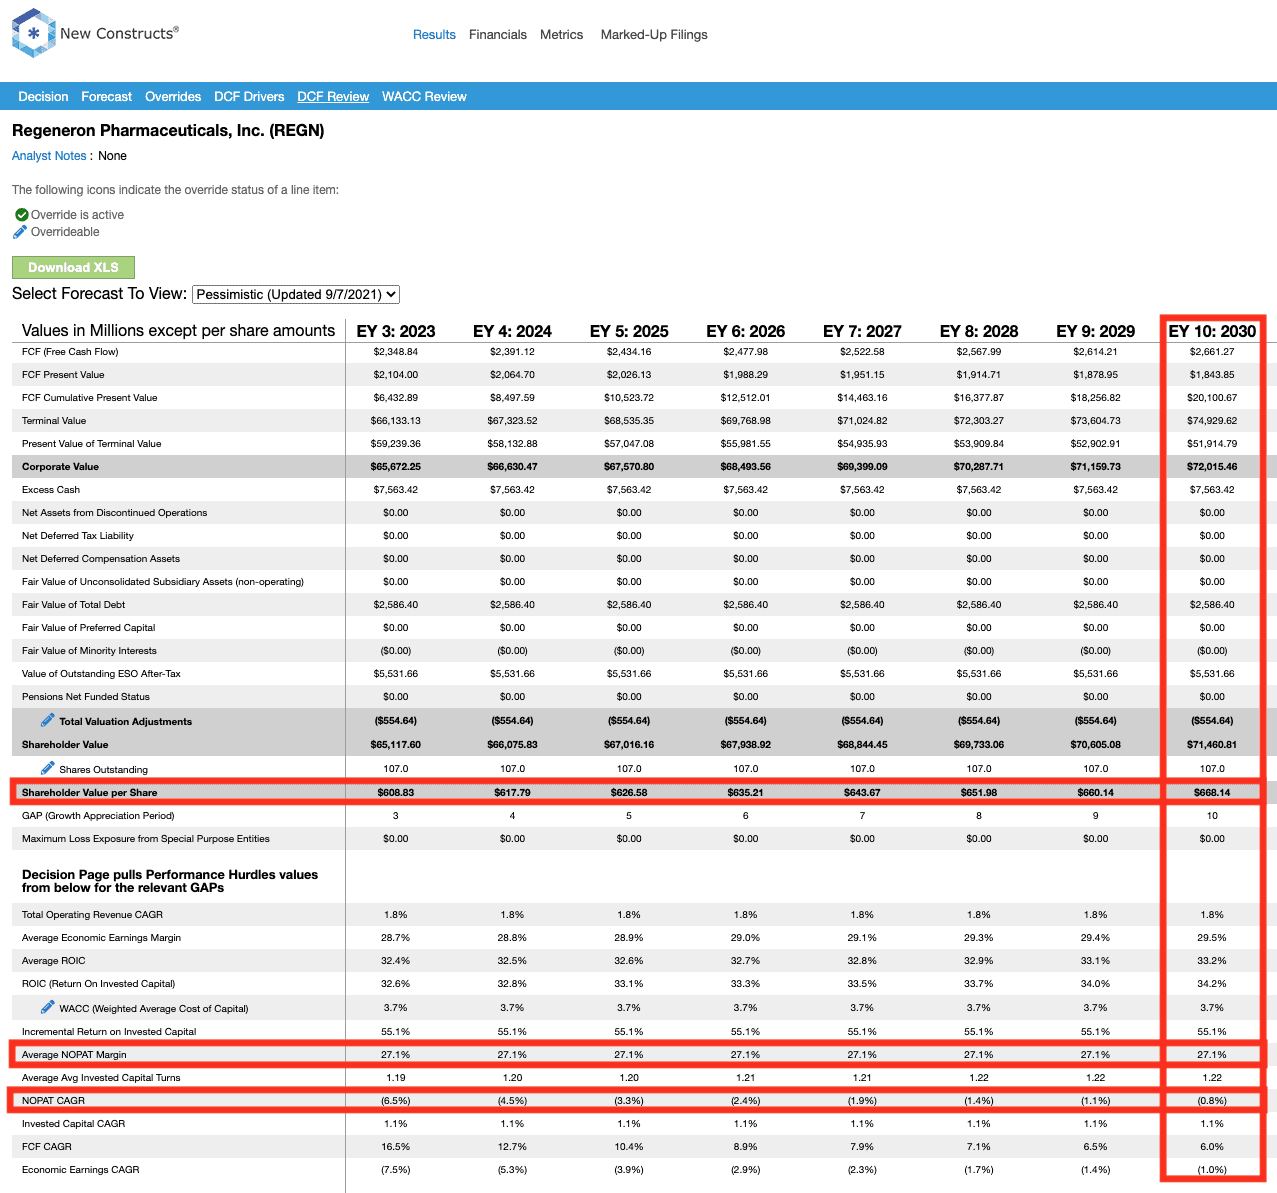
Below, we use our reverse discounted cash flow (DCF) model to analyze the expectations for future growth in cash flows baked into a couple of stock price scenarios for Regeneron.
In the first scenario, we assume Regeneron’s:
- NOPAT margin falls to 27% (vs. five-year average of 28%) from 2021 through 2030, and
- revenue grows by just 2% compounded annually from 2021 to 2030 (vs. consensus CAGR of 8% for 2021-2025)
In this scenario, Regeneron’s NOPAT falls by 1% compounded annually over the next decade and the stock is worth $668/share today – nearly equal to the current price. See the math behind this reverse DCF scenario. Should Regeneron grow NOPAT anywhere near more historical levels, the stock has 50%+ upside, as we’ll show next.
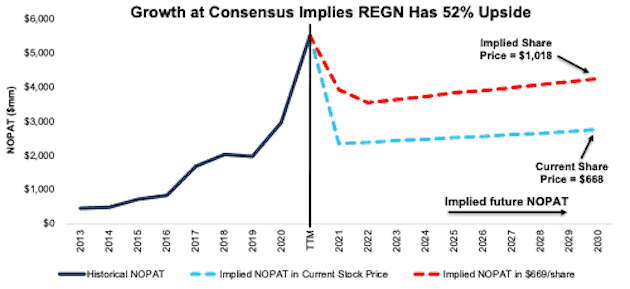
Shares Could Reach $1,018 or Higher: If we assume Regeneron’s:
- NOPAT margin falls to 30% (three-year average, vs. 45% TTM) from 2021 through 2030, and
- revenue grows at an 8% CAGR through 2025 (equal to 2021-2025 consensus), and
- revenue grows 2% a year from 2026 - 2030, then
the stock is worth $1,018/share today – 52% above the current price. See the math behind this reverse DCF scenario. In this scenario, Regeneron grows NOPAT by 4% compounded annually over the next decade. For reference, Regeneron grew NOPAT by 25% compounded annually from 2012-2020.
Should Regeneron grow profits closer to historical levels, the upside in the stock is even greater.
Figure 5: Regeneron’s Historical and Implied NOPAT: DCF Valuation Scenarios
Sources: New Constructs, LLC and company filings.
Good Companies (High ROIC), but Not Good Stocks (Expensive Valuation)
The firms below are highly profitable, however, a high ROIC company is not always a good stock. ROIC is just one of five criteria that drive our stock ratings. Not only does a good stock have a strong ROIC and profitable business, but it also has relatively low expectations for future profit growth baked into its valuation.
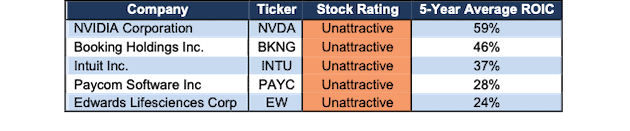
Figure 6 shows the list of S&P 500 firms with the highest five-year average ROICs but Unattractive Stock Ratings, or good companies, not good stocks.
Figure 6: S&P 500 Companies with High ROIC and Unattractive-or-Worse Ratings: TTM
Sources: New Constructs, LLC and company filings.
Intuit (INTU): a Quality Company Priced with Extraordinary Expectations
While Intuit’s profitability has steadily improved since 2004, its valuation implies profits will grow more than 4x from current levels. The lofty expectations baked into the stock price make this quality business a bad stock with unattractive risk/reward.
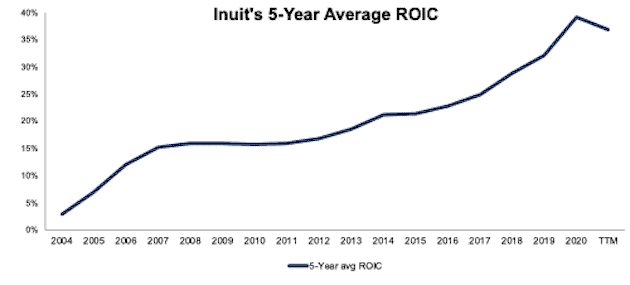
Intuit’s Rising ROIC: Figure 7 compares Intuit’s five-year average ROIC since 2004. Intuit’s five-year average ROIC rose from 3% in 2004 to 37% TTM.
Figure 7: Intuit’s Five-Year Average ROIC: 2004 – TTM
Sources: New Constructs, LLC and company filings.
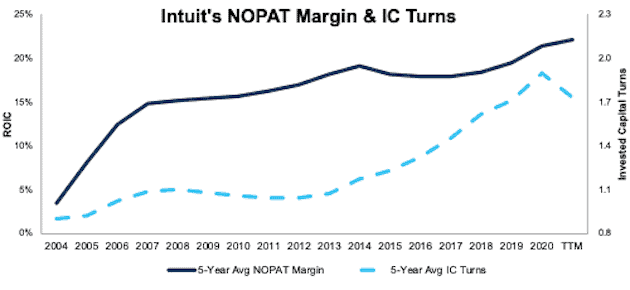
Improved Margins and Invested Capital Turns Drive ROIC Higher: Figure 8 shows that rising five-year average NOPAT margin and five-year average invested capital turns drive the firm’s ROIC higher. The firm’s five-year average NOPAT margin rose from 3% in 2004 to 22% TTM, while its invested capital turns improved from 0.8 to 1.7 over the same time.
Figure 8: Intuit’s Five-Year Average NOPAT Margin and IC Turns: 2004 – TTM
Sources: New Constructs, LLC and company filings.
Intuit’s Stock Has Large Profit Growth Expectations Baked into Its Price: Intuit’s price-to-economic book value (PEBV) ratio of 4.7 implies that the market expects Intuit’s profits to grow 470% from current levels.
Below, we use our reverse DCF to analyze the expectations for future growth in cash flows baked into a couple of stock price scenarios for Intuit.
In the first scenario, we assume Intuit:
- maintains TTM NOPAT margin of 24% (all-time high) from 2021 through 2030, and
- grows revenue by 21% compounded annually from 2021 to 2030 (vs. consensus CAGR of 14% for 2021-2023)
In this scenario, Intuit’s NOPAT grows 20% compounded annually for the next decade and the stock is worth $560/share today – equal to the current price. See the math behind this reverse DCF scenario. For reference, Intuit grew NOPAT by 12% compounded annually over the past decade.
In this scenario, Intuit’s NOPAT in 2030 is $12.1 billion, or 459% greater than TTM levels. This level of NOPAT would also rank 10th out of 464 Technology companies under coverage.
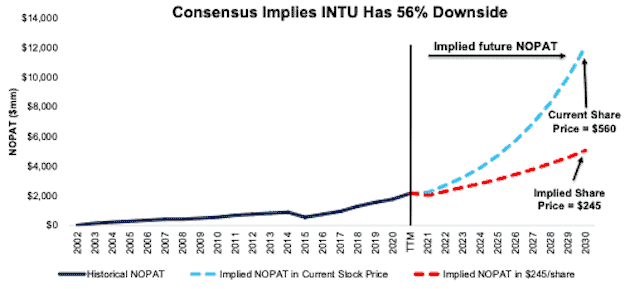
Shares Could Fall 56% or More If Growth Meets Consensus: If we assume Intuit’s:
- NOPAT margin falls to 23% (three-year average) from 2021 through 2030, and
- revenue grows at a 14% CAGR through 2023 (equal to 2021-2023 consensus), and
- revenue grows 10% a year from 2024 - 2030, then
the stock is worth $245/share today – 56% below the current price. See the math behind this reverse DCF scenario. In this scenario, Intuit grows NOPAT by 11% compounded annually over the next decade, or nearly equal to its NOPAT CAGR during the prior decade.
Should Intuit not grow revenue at consensus levels, the downside in the stock is even greater.
Figure 9: Intuit’s Historical and Implied NOPAT: DCF Valuation Scenarios
Sources: New Constructs, LLC and company filings.
This article originally published on September 8, 2021.
Disclosure: David Trainer, Kyle Guske II, Alex Sword, and Matt Shuler receive no compensation to write about any specific stock, style, or theme.
Follow us on Twitter, Facebook, LinkedIn, and StockTwits for real-time alerts on all our research.
[1] For 3rd-party reviews, including The Journal of Financial Economics, on our more reliable fundamental data and research click here and here.
[2] We use stock prices from 8/18/21 in Figure 1 because that is the date when all the 2Q21 10-Qs for the S&P 500 constituents were available.
[3] Five-year average ROIC = five-year average NOPAT / five-year average invested capital
[4] Five-year average NOPAT margin = five-year average NOPAT / five-year average revenue
[5] Five-year average invested capital turns = five-year average revenue / five-year average invested capital
1 Response to "Using ROIC to Find the Best & Worst Stocks in the S&P 500"
Gave you a try, Am happy. 🙂