This report updates the valuation scenarios we originally published in Warby Parker Direct Listing: See Through This Optical Illusion to account for recent revenue guidance provided by management for 2021 and 2022. Even with more transparency into expected growth rates, the direct listing is still overvalued.
Warby Parker Inc. (WRBY: $3 billion expected valuation) is set to debut as a public company via a direct listing on September 29. For its last round of funding, the firm fetched a roughly $3 billion valuation, which would earn it our Very Unattractive rating.
At first glance, it may seem like Warby Parker is a profitable company, given its well-known brand and early entrance into the ecommerce eyewear space, but we urge investors to see through this optical illusion, as the company’s fundamentals are headed the wrong direction. With an expected valuation of $3 billion, we don’t think investors should expect to make any money in this stock.
We believe the stock is worth as little as ~$600 million. A $3 billion valuation implies that Warby Parker will achieve some very optimistic milestones, including reversing a downward trend in profits, growing revenue by more than 600%, and generating more revenue than the current eyewear market leader, Vision Source.
Despite a strong brand and visibility in the marketplace, Warby Parker maintains a very small share of the highly fragmented eyewear market and to make matters worse, consumers are reluctant to purchase eyeglasses online, instead favoring in-store purchases.
Our IPO research aims to provide investors with more reliable fundamental research.
Ecommerce Strategy Is Flawed
Warby Parker’s initial focus on ecommerce-based eyewear may have been novel in 2010, but this concept hasn’t lived up to the success ecommerce has seen in other industries. Consumers, especially those who wear prescription lenses, still prefer to shop for their glasses in person rather than online, as evidenced by the slow adoption of ecommerce sales in the eyewear industry.
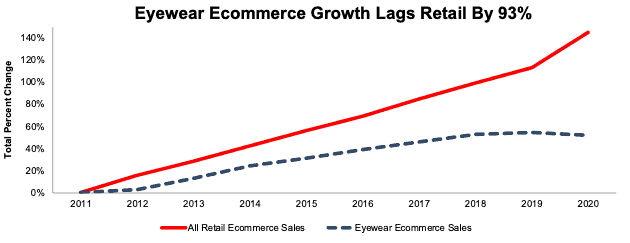
Over the past five years ecommerce sales in the eyewear industry grew by just 4% compounded annually compared to an 18% CAGR for overall ecommerce retail sales, per Figure 1. In 2020, online sales of eyewear accounted for $1.5 billion, or just 4%, of total eyeglass sales in the United States. Should adoption of online sales continue to lag the overall market, Warby Parker will struggle to justify its expected valuation.
Figure 1: Cumulative Ecommerce Growth: 2011-2020
Sources: New Constructs, LLC and company filings
Well Known, But Hold a Small Share Of a Fragmented Market
Warby Parker operates in the eyewear industry in the United States, which, as of 2020, had a total market size by revenue of just under $35 billion. With a projected industry growth rate of 8.5% compounded annually through 2028, many investors may be excited about the growth potential of this direct listing. The problem, however, is that Warby Parker operates in a highly fragmented market with many small, private companies, and, despite its well-known brand and value proposition, has yet to take significant market share.
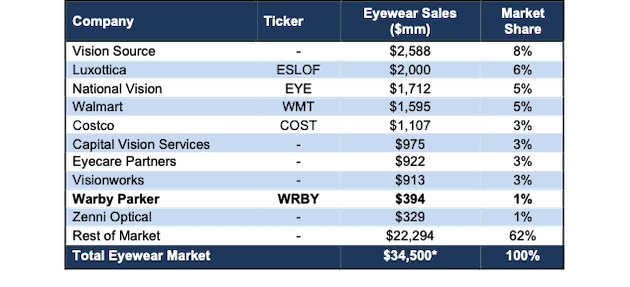
Per Figure 2, Warby Parker holds just 1% share of the U.S. Eyewear market, which is well below larger competitors such as Vision Source, Luxottica, National Vision (EYE), Walmart Vision (WMT), Costco Vision (COST), VisionWorks, and more.
Importantly, larger (and profitable) competitors such as National Vision, have a distinct advantage over Warby Parker. With a much larger base of retail stores (where consumers prefer to shop for eyewear), they have revenue, profits and can move into ecommerce more easily and cheaply than Warby Parker can expand its physical retail presence.
Figure 2: Warby Parker: Market Share Amongst Peers (2020)
Sources: New Constructs, LLC and company filings
*United States Eyewear sales in 2020.
Building a Retail Presence Will Further Limit Profitability…
While more than 60% of Warby Parker’s total revenue comes from online sales, management is well aware of the limitations of its ecommerce strategy. From the S-1, (emphasis added): “Improving upon the consumer in-store experience through an online platform is difficult due to broad consumer demands on selection, quality, convenience, and affordability.”
In fact, management believes more retail locations, not ecommerce, are the key to future growth. Again, from the S-1:
“our growth strategy will depend, in large part, on acquiring customers through the growth of our retail store base and expansion of our existing retail store operations.”
If retail stores are a key growth driver, then Warby Parker is playing catch up to the competition. According to its S-1, Warby Parker has 142 retail stores in 35 states, with three additional stores in Canada. Meanwhile, National Vision has 1,205 retail locations, or over 8x Warby Parker.
In other words, Warby Parker is already an unprofitable ecommerce business that needs to underwrite a costly and capital intensive brick-and-mortar expansion. Yet, its recent valuation of $3 billion already implies it will be significantly more profitable than today. Consider us skeptical of such a feat.
…And so Will a Lack of Differentiation
Through strategic advertising efforts, Warby Parker has become a household name for buying glasses online. Nevertheless, its products and services lack differentiation. Warby Parker markets its Home Try-On offering, which allows customers to pick five frames to try on for free at home, then return the frames they do not want. While this strategy undoubtedly eases some customers’ fears of ordering a pair of glasses they don’t like, it results in additional costs to manage the logistics and intake of returns.
Additionally, this service is not a proprietary service and likely would have already been replicated if it didn’t drastically increase shipping costs. Warby Parker’s closest online competitor, Zenni Optical, already offers a “Virtual Try-On” that allows customers to upload pictures of themselves to see what they look like in the glasses.
Fundamentals Don’t Look Great Either
Look no further than Warby Parker’s operating expenses for evidence that its high-touch ecommerce strategy is not benefiting from scale. Selling, general, and administrative expenses increased from 69% of revenue in 2018 to 73% in 2020, while total operating expenses increased from 109% to 114% of revenue over the same time.
Other fundamentals, for those investors that care about them, don’t look great either. Warby Parker has grown revenue by 20% compounded annually since 2018, but its profits have deteriorated.
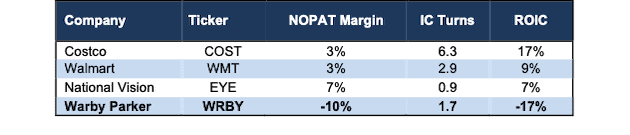
Warby Parker’s net operating profit after-tax (NOPAT) fell from $3 million in 2019 to -$40 million in 2020. NOPAT margin declined from 1% in 2019 to -10% in 2020, while invested capital turns (a measure of balance sheet efficiency) fell from 1.8 to 1.7 over the same time. Falling operational and capital efficiency drive the firm’s return on invested capital (ROIC) from 2% in 2019 to -17% in 2020. While top line growth may excite investors, falling NOPAT margin and ROIC will lead to shareholder value destruction even as revenue increases.
Figure 3 highlights Warby Parker’s fundamental disadvantage, i.e. lack of profitability, compared to its publicly-traded peers.
Figure 3: Warby Parker Profitability Vs Public Peers*: Fiscal 2020
Sources: New Constructs, LLC and company filings
*Luxottica (ESLOF) is publicly traded on the OTC market, but not currently in our coverage universe.
Limited Stupid Money Acquisition Risk
Given that Warby Parker lacks material competitive advantages, has a limited retail presence, and is already overvalued, we think it is unlikely competitors will see Warby Parker as an attractive acquisition target. It is more prudent for competition to simply outprice and outcompete Warby, rather than overspend on an acquisition. In addition, Warby Parker has multiple anti-takeover provisions in place, including preferred stock, staggered board, public benefit corporation status (more on this below), and more.
$3 Billion Valuation = Warby Parker Will be the Largest U.S. Eyewear Seller (By Sales)
When we use our reverse discounted cash flow (DCF) model to analyze the future cash flow expectations baked into Warby Parker’s expected direct listing valuation, we can provide clear, mathematical evidence that the $3 billion valuation is too high and offers very unattractive risk/reward.
In order to justify the expected direct listing valuation of $3 billion, Warby Parker must:
- Immediately achieve a 7% NOPAT margin (equal to National Vision’s 2020 NOPAT margin, compared to -10% in 2020) and
- grow revenue by 36% in 2021 and 25% in 2022 (equal to management’s guidance) and
- grow revenue by 25% each year thereafter through 2028, which is nearly 3x the projected global industry growth rate through 2028.
In this scenario, Warby Parker would generate $2.6 billion in revenue in 2028, which is more than 6x its 2020 revenue and greater than National Vision’s 2020 revenue.
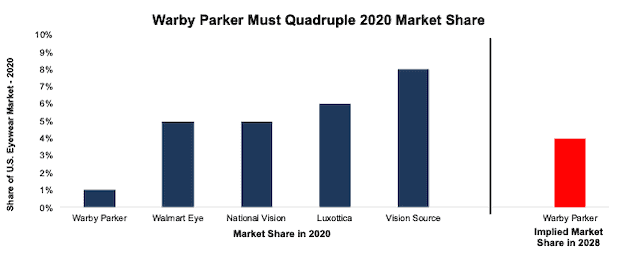
This implied revenue represents more than 4% of the projected 2028 total United States eyewear market. In other words, a $3 billion valuation implies Warby Parker will generate more revenue than Vision Source, the current leader in sales and market share in the United States, generated in 2020 and quadruple its market share. See Figure 4.
Figure 4: Warby Parker Market Share Vs. Largest Competitors
Sources: New Constructs, LLC and company filings
DCF Scenario 2: Growth at 2x Industry Expectations = $1.3 Billion Valuation
We review an additional DCF scenario to highlight the downside risk even if Warby Parker’s revenue growth doubles the expected industry growth rate.
If we assume Warby Parker:
- immediately achieves a NOPAT margin of 7% and
- grows revenue by 17% compounded annually over the next eight years (double the projected industry growth rate), which includes 36% YoY in 2021 and 25% YoY in 2022 (management guidance) then
WRBY is worth just $1.3 billion today – a 57% downside to the expected direct listing valuation. See the math behind this reverse DCF scenario.
DCF Scenario 3: Growth at Industry Expectations = $638 Million Valuation
We review a third DCF scenario to highlight the downside risk should Warby Parker’s revenue growth fall more in line with industry expectations.
If we assume Warby Parker:
- immediately achieves a NOPAT margin of 6%
- grows revenue by 13% compounded annually (1.5x the projected industry growth rate) over the next eight years, which includes 36% YoY in 2021 and 25% YoY in 2022 (management guidance) then
WRBY is worth just $638 million today – a 79% downside to the expected direct listing valuation. See the math behind this reverse DCF scenario.
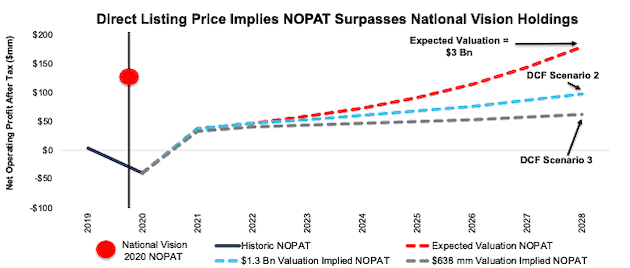
Figure 5 compares the firm’s implied future NOPAT in these three scenarios to its historical NOPAT.
Figure 5: Direct Listing Valuation Is Much Too High
Sources: New Constructs, LLC and company filings
Each of the above scenarios also assumes Warby Parker grows revenue, NOPAT, and FCF without increasing working capital or fixed assets. This assumption is highly unlikely but allows us to create best-case scenarios that demonstrate the level of expectations embedded in the current valuation. For reference, Warby Parker’s invested capital increased $60 million (15% of revenue) YoY in 2020. If we assume Warby Parker’s invested capital increased at a similar rate in DCF scenario 2 above, the downside risk is even larger.
Other Red Flags for Investors
With a lofty valuation that implies significant improvement in both revenue and profits, investors should be aware that Warby Parker’s S-1 also includes these other red flags.
The Founders Have Total Control. Warby Parker will be issuing multiple classes of common stock, with class A shares sold to the public and class B shares reserved for management and the founders. Warby Parker discloses in its S-1 that the two founders, “if they choose to act together, will have the ability to control all matters submitted to stockholders for approval, including controlling the outcome of director elections.”
In other words, despite new investors paying a premium to buy the direct listing, Warby Parker’s co-founders and other owners will continue to control the company, and new shareholders may have no control over corporate governance.
Shareholders Are Not the Only Priority: Warby Parker, possibly looking to garner momentum behind rising interest in environment, social, and corporate governance (ESG) investing, states in its S-1 that it is a “public benefit corporation” and it is the company’s “duty to balance a variety of interests [which] may result in actions that do not maximize stockholder value.”
Warby Parker claims that it is committed to benefitting all of its stakeholders, which the company describes as its customers, employees, the community, the environment, and its business partners in addition to its actual stockholders. While the firm’s commitment to helping other “stakeholders” may give a bump to its ESG score, the firm admits that it may not always act in the best interest of its shareholders.
Adjusted EBITDA Distorts Earnings
Many unprofitable companies present non-GAAP metrics to appear more profitable than they really are, and Warby Parker is no different. Warby Parker presents the popular Adjusted EBITDA metric as a key performance indicator. Not surprisingly, Adjusted EBITDA gives a more bullish picture of the firm’s business than GAAP net income and our Core Earnings.
For instance, Warby Parker’s 2020 adjusted EBITDA removes $44.9 million in stock-based compensation costs and $18 million in depreciation and amortization. After removing all items, Warby Parker reports adjusted EBITDA of $7.7 million in 2020. Meanwhile, economic earnings, the true cash flows of the business, are significantly lower at -$52 million. Warby Parker’s adjusted EBITDA follows the same declining trend in economic earnings over the past two years but investors need to be aware that there is always a risk that adjusted EBITDA could be used to manipulate earnings going forward.
We Don’t Know If We Can Trust the Financials: Investors should take Warby Parker’s reported numbers with a grain of salt because the firm’s management identified a material weakness in internal controls over financing reporting in 2020. As an emerging growth company, Warby Parker is not required to have an independent auditor provide an opinion on internal controls, but had it done so, more issues may have surfaced. From the S-1: “we believe that it is possible that, had we and our independent registered public accounting firm performed an assessment or audit, respectively, of our internal control over financial reporting in accordance with the provisions of the Sarbanes-Oxley Act, additional material weaknesses may have been identified.”
Additionally, the firm makes no assurances that the issues have been fixed, nor that it has identified all existing material weaknesses. Weaknesses in internal controls increase the risk that the firm’s financials are fraudulent and/or misleading.
Emerging Growth Status Limits Transparency
By electing to operate as an “Emerging Growth Company”, Warby Parker is exempt from certain requirements that are beneficial to shareholders. For instance, and as noted above the SEC does not currently require Warby Parker to have an independent auditor provide an opinion on internal controls. Additionally, Warby Parker is not required to provide information on executive compensation structure and can delay adoption of certain accounting procedures, which limit the transparency of its financial statements. Get more details on the risks of investing in emerging growth companies here.
Critical Details Found in Financial Filings By Our Robo-Analyst Technology
Fact: we provide superior fundamental data and earnings models – unrivaled in the world.
Proof: Core Earnings: New Data and Evidence, published in The Journal of Financial Economics.
Below are specifics on the adjustments we make based on Robo-Analyst findings in Warby Parker’s S-1:
Income Statement: we made $16 million in adjustments, with a net effect of removing $16 million in non-operating expense (4% of revenue). You can see all the adjustments made to Warby Parker’s income statement here.
Balance Sheet: we made $388 million in adjustments to calculate invested capital with a net decrease of $104 million. The most notable adjustment was $142 million in operating leases. This adjustment represented 42% of reported net assets. You can see all the adjustments made to Warby Parker’s balance sheet here.
Valuation: we made $978 million in adjustments, with a net effect of decreasing shareholder value by $546 million. The largest adjustment to shareholder value was $504 million in preferred capital. This adjustment represents 18% of Warby Parker’s expected valuation. You can see all the adjustments made to Warby Parker’s valuation here.
This article originally published on September 23, 2021.
Disclosure: David Trainer, Kyle Guske II, Alex Sword, and Matt Shuler receive no compensation to write about any specific stock, style, or theme.
Follow us on Twitter, Facebook, LinkedIn, and StockTwits for real-time alerts on all our research.