
Check out this week’s Danger Zone interview with Chuck Jaffe of Money Life.
Passive investing is no longer the safe strategy. However, that does not mean investors should blindly rush to active strategies in search of outperformance. Diligence remains the most important ingredient in successful long-term investing.
Only our mutual fund ratings leverage our uniquely rigorous diligence of fund holdings. This diligence provides insights into the fundamentals of the overall fund so investors can determine whether or not a fund allocates sufficiently to quality stocks and can justify its fees. This week, we’ve identified a mutual fund with higher fees and worse holdings than its benchmark and the overall market.
Despite its 3- and 4-Star Morningstar rating (depending upon share class), Goldman Sachs Growth Opportunities Fund (GGOAX) is in the Danger Zone.
Backwards Looking Research Overrates this Fund
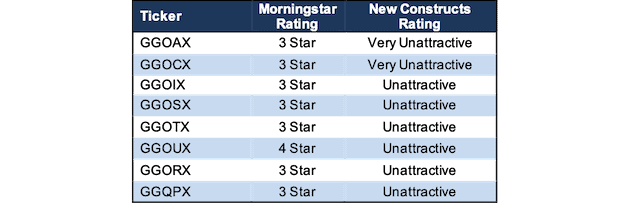
Investors that rely solely on past performance may miss the true risk of investing in this fund. Per Figure 1, GGOUX earns the 4-Star rating from Morningstar and GGOAX, GGOCX, GGOIX, GGOSX, GGOTX, GGORX, and GGQPX earn the 3-Star rating.
Meanwhile, GGOAX, along with GGOCX, earn our Very Unattractive Rating, the worst of our Predictive Risk/Reward Fund ratings, which leverage our superior research[1] featured by Harvard Business School and MIT Sloan.
Figure 1: Goldman Sachs Growth Opportunities Fund Ratings
Sources: New Constructs, LLC, company, ETF and mutual fund filings, and Morningstar
GGOAX allocates significantly more capital to companies with low profitability and high profit growth expectations baked into their stock prices, which makes its portfolio riskier than its benchmark and the overall market.
Holdings Research Reveals a Low-Quality Portfolio
The only justification for a mutual fund to charge higher fees than its ETF benchmark is “active” management that leads to out-performance. As we show in “The Hidden Dangers of Passive Investing”, passive strategies are overcrowded, which makes outperforming more difficult. In this landscape, an active strategy has an opportunity to outperform, provided it allocates to higher quality holdings than its benchmark. To assess holdings quality, we leverage our Robo-Analyst technology[2] to drill down and analyze the individual stocks for 7,100+ funds.
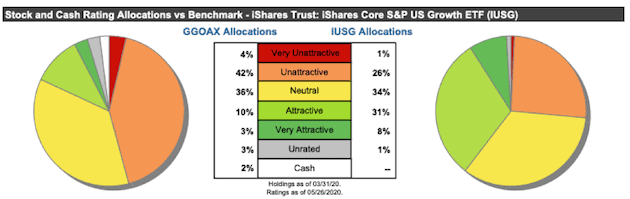
Per Figure 2, Goldman Sachs Growth Opportunities Fund’s asset allocation poses greater downside risk and holds less upside potential than its benchmark, the iShares Core S&P U.S. Growth ETF (IUSG).
GGOAX allocates just 13% of its portfolio to Attractive-or-better rated stocks compared to 39% for IUSG. On the flip side, GGOAX’s exposure to Unattractive-or-worse rated stocks is much higher, at 46%, versus IUSG at 27%.
Figure 2: GGOAX Allocates Capital to More Low-Quality Holdings
Sources: New Constructs, LLC and company, ETF and mutual fund filings
Given the unfavorable allocation of Attractive-or-better vs. Unattractive-or-worse rated stocks relative to the benchmark, GGOAX appears poorly positioned to generate the outperformance required to justify its fees.
Active Management Done Wrong
In its quarterly fact card, Goldman Sachs Growth Opportunities Fund describes active management as “a potential performance advantage from a portfolio that looks different from its benchmark.”
While the description is accurate – GGOAX’s portfolio is different from its benchmark – it does not necessarily apply to a fund that holds lower quality stocks than the benchmark. Furthermore, the fund’s strategy is described as “fundamentally driven” and management looks for “specific characteristics believed to indicate a high-quality business with sustainable growth, including strong business franchises, favorable long-term prospects, and excellent management.”
Unfortunately, these broad characteristics don't tell investors much. We wonder why management is not more specific and does not mention any metrics, such as return on invested capital (ROIC). An investment process that emphasizes improvement in ROIC should find better stocks than one using flawed traditional metrics. GGOAX’s “fundamentally driven, active approach” has not found better stocks.
Stock Selection Methodology Finds Bad Stocks
Our research shows that GGOAX allocates to stocks with significantly lower ROICs than the benchmark and overall market (S&P 500). Making matters worse, our research finds that GGOAX’s holdings are more expensive, as measured by the higher expectations for future profit growth reflected in their valuations.
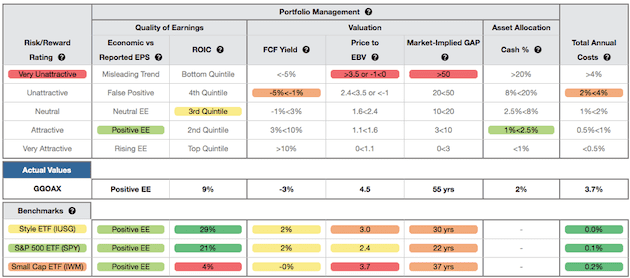
Figure 3 contains our detailed rating for GGOAX, which includes each of the criteria we use to rate all funds under coverage. These criteria are the same for our Stock Rating Methodology because the performance of a fund’s holdings equals the performance of a fund after fees.
Figure 3: Goldman Sachs Growth Opportunities Fund Rating Breakdown
Sources: New Constructs, LLC and company, ETF and mutual fund filings
As Figure 3 shows, GGOAX’s holdings are inferior to its benchmark, IUSG, and the S&P 500 (SPY), in four of the five criteria that make up our holdings/Portfolio Management analysis. Specifically:
- GGOAX’s ROIC is 9% and well below the 29% earned by IUSG and the 21% earned by SPY.
- GGOAX’s free cash flow yield of -3% is worse than the 2% of IUSG and SPY.
- The price-to-economic book value (PEBV) ratio for GGOAX is 4.5, which is significantly greater than the 3.0 for IUSG holdings and the 2.4 of SPY holdings.
- Our discounted cash flow analysis reveals an average market implied growth appreciation period (GAP) of 55 years for GGOAX’s holdings compared to 30 years for IUSG and 22 years for SPY.
In other words, the stocks held by GGOAX generate inferior cash flows and have higher valuations compared to IUSG and SPY. The market expectations for stocks held by GGOAX imply profit growth (measured by PEBV ratio) that is well above the profit growth expectations embedded in IUSG’s and SPY’s holdings. Lower historical profits and higher expectations for future profits are a bad combination. Furthermore, in the current market, there is no reason to allocate to overvalued stocks when there are many industry leading firms trading at historical discounts, including recent Long Ideas SYSCO Corporation (SYY), Darden Restaurants (DRI), Southwest Airlines (LUV), JPMorgan Chase (JPM), and more.
Style Drift Is Another Red Flag
Prior research has found that fund managers in one style drift into other styles to improve their relative rankings by Morningstar and look more attractive to investors.
Morningstar classifies GGOAX (and other share classes) as a Mid Cap Growth fund. Mid Cap is commonly defined as companies with market capitalizations between $2 billion and $10 billion. However, the weighted-average market cap of GGOAX’s holdings is $23.3 billion and all of its top 10 holdings have market capitalizations greater than $21 billion.
We classify the fund as All Cap Growth. Without holdings analysis, investors in GGOAX think they’re getting exposure to Mid Cap stocks, when in reality the size of firms skews much larger.
Deep Dive on a Bad Stock Holding
Coupa Software (COUP: $211/share) is one of GGOAX’s worst holdings due to its growing losses, negative ROIC, and overvalued stock price. Since fiscal 2017, Coupa Software’s revenue has grown by 43% compounded annually while core earnings have fallen from -$35 million to -$82 million over the same time, see Figure 4.
Figure 4: Coupa Software’s Revenue & Core Earnings Since 2017
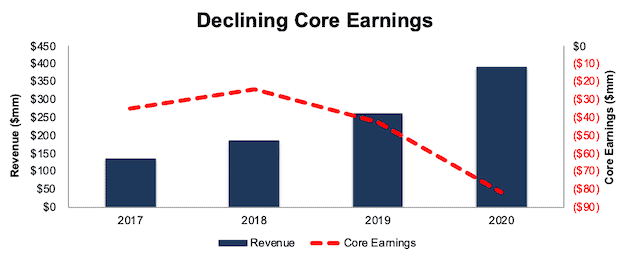
Sources: New Constructs, LLC and company filings
Economic earnings, which not only account for unusual items on the income statement but also changes to the balance sheet, look even worse. Economic earnings have declined from -$53 million in fiscal 2017 to -$115 million in fiscal 2020. Coupa Software’s ROIC has also been negative throughout its time as a public company, and is currently -8%.
COUP is Significantly Overvalued
Despite the deterioration in Coupa Software’s fundamentals, shares are up ~44% year-to-date and 88% over the past year (S&P +6%) and are significantly overvalued. We use our reverse DCF model to quantify the growth in cash flows COUP must achieve to justify its valuation.
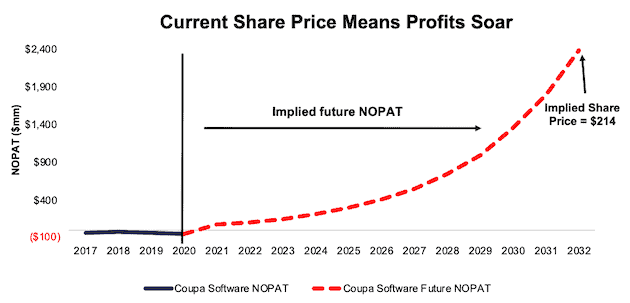
To justify its current price of $211/share, COUP must immediately achieve a 13% NOPAT margin (average of 65 Software firms under coverage with positive margins compared to -13% TTM) and grow revenue by 38% compounded annually for the next 12 years. See the math behind this reverse DCF scenario. In this scenario, COUP would be generating $18 billion in revenue 12 years from now, which today would rank behind only Microsoft (MSFT), Oracle (ORCL), and SAP (SAP) in terms of annual revenue out of the 113 Software firms under coverage.
Figure 5 compares the firm’s implied future NOPAT to its historical NOPAT for this scenario. This scenario implies Coupa Software’s NOPAT 12 years from now will be nearly $2.4 billion compared to -$52 million in fiscal 2020. In any scenario worse than this one, COUP holds significant downside risk, as we’ll show.
Figure 5: Current Valuation Implies Drastic Profit Growth: Scenario 1
Sources: New Constructs, LLC and company filings.
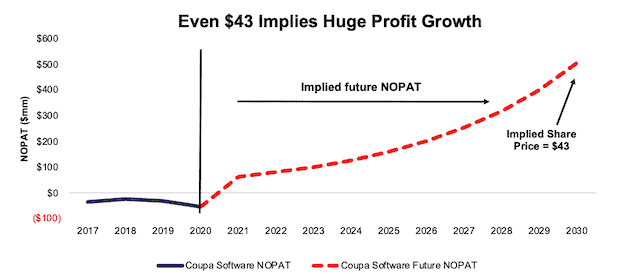
Even if we assume COUP can achieve a 13% NOPAT margin and grow revenue by 26% compounded annually (consensus estimate for 2021 and 2022) for the next decade, the stock is worth only $43/share today – an 80% downside to the current stock price. See the math behind this reverse DCF scenario.
Figure 6 compares the firm’s implied future NOPAT to its historical NOPAT for this scenario. This scenario implies Coupa Software’s NOPAT 10 years from now will be over $500 million, compared to -$52 million in fiscal 2020.
Figure 6: COUP Has Significant Downside Risk: Scenario 2
Sources: New Constructs, LLC and company filings.
Each of these scenarios also assumes Coupa Software is able to grow revenue, NOPAT and FCF without increasing working capital or fixed assets. This assumption is unlikely but allows us to create best-case scenarios that demonstrate how high expectations embedded in the current valuation are. For reference, Coupa Software’s invested capital grew by an average of $197 million a year (51% of fiscal 2020 revenue) over the past three years.
Excessive Fees Make Outperformance Even More Difficult
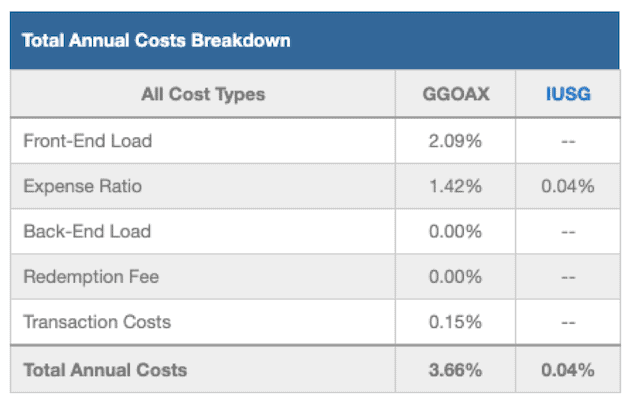
At 3.66%, GGOAX’s total annual costs (TAC) are higher than 95% of the 568 All Cap Growth mutual funds under coverage. For comparison, the average TAC of all All Cap Growth mutual funds under coverage is 1.71%, the weighted average is 1.47%, and the benchmark ETF (IUSG) has total annual costs of 0.04%.
Our TAC metric accounts for more than just expense ratios. We consider the impact of front-end loads, back-end loads, redemption fees, and transaction costs. For example, GGOAX’s front-end load adds 2.09% to its total annual costs and its annual turnover ratio of 69% adds 0.15% to its total annual costs – neither of which are captured by the expense ratio. Figure 7 shows our breakdown of GGOAX’s total annual costs, which is also available for all of the ~7,100 mutual funds under coverage.
Figure 7: Goldman Sachs Growth Opportunities Fund Total Annual Costs Breakdown
Sources: New Constructs, LLC and company, ETF and mutual fund filings
To justify its higher fees, each class of the fund must outperform its benchmark by the following amounts over three years:
- GGOAX must outperform by an average of 3.62% annually.
- GGOCX must outperform by an average of 2.35% annually.
- GGORX must outperform by an average of 1.78% annually.
- GGOSX must outperform by an average of 1.66% annually.
- GGOTX must outperform by an average of 1.21% annually.
- GGOIX must outperform by an average of 1.10% annually.
- GGOUX must outperform by an average of 1.09% annually.
- GGQPX must outperform by an average of 1.09% annually.
An in-depth analysis of GGOAX and its TAC is available in our standard mutual fund report.
GGOAX’s Performance Can’t Justify Its Fees
When we take into account its load, which adds 2.09% to its total annual costs, we see that GGOAX has failed to outperform and justify its fees.
GGOAX’s load adjusted one-year quarter-end average annual total return underperformed IUSG by over 7 percentage points and SPY by over 4 percentage points. Its load adjusted three-, five-, and 10-year quarter-end average annual total return underperformed IUSG, and its load adjusted five- and 10-year quarter-end average annual total return underperformed SPY. Overall, GGOAX has failed to justify its fees.
Given that 46% of assets are allocated to stocks with Unattractive-or-worse ratings, GGOAX looks likely to continue to underperform moving forward.
The Importance of Holdings-Based Fund Analysis
Smart fund (or ETF) investing means analyzing the holdings of each mutual fund. Failure to do so is a failure to perform proper due diligence. Simply buying a mutual fund or ETF based on past performance does not necessarily lead to outperformance. Similarly, blindly diversifying through index funds is no substitute for diligence. Only through holdings-based analysis can one determine if a fund’s methodology leads managers to pick high-quality or low-quality stocks.
However, most investors don’t realize they can access sophisticated fundamental research[3] using data that corrects market inefficiencies and generates alpha. Our Robo-Analyst technology analyzes the holdings of all 591 ETFs and mutual funds in the All Cap Growth style and ~7,800 ETFs and mutual funds under coverage to avoid “the danger within.” This diligence allows us to cut through the noise and identify potentially dangerous funds that traditional backward-looking fund research may overlook, such as GGOAX.
Better-Rated All Cap Growth Funds
The following are some All Cap Growth mutual funds that earn an Attractive rating, have more than $100 million in assets under management, and have below average TAC.
- JPMorgan Intrepid Growth Fund (JGIRX) – 0.69% TAC
- MassMutual Premier Disciplined Growth Fund (MPDIX) – 0.71% TAC
- Legg Mason Partners ClearBridge Aggressive Growth Fund (LSIFX) – 0.80% TAC
- Glenmede Quantitative U.S. Large Cap Growth Equity Portfolio (GTILX) – 0.90% TAC
- AB Concentrated Growth fund (WPSIX) – 0.91% TAC
This article originally published on June 1, 2020.
Disclosure: David Trainer, Kyle Guske II, and Matt Shuler receive no compensation to write about any specific stock, sector, style, or theme.
Follow us on Twitter, Facebook, LinkedIn, and StockTwits for real-time alerts on all our research.
[1] Our core earnings are a superior measure of profits, as demonstrated in In Core Earnings: New Data & Evidence a paper by professors at Harvard Business School (HBS) & MIT Sloan. The paper empirically shows that our data is superior to “Income Before Special Items” from Compustat, owned by S&P Global (SPGI).
[2] Harvard Business School features the powerful impact of our research automation technology in the case study New Constructs: Disrupting Fundamental Analysis with Robo-Analysts.
[3] This paper compares our analytics on a mega cap company to Bloomberg and Capital IQ (SPGI) in a detailed appendix.