
With the 2020 election less than a week away, many investors are uncertain of where to deploy their capital. The outcome of the election may significantly impact future economic growth and create winners and losers at the sector level (e.g. Energy) and individual stock level. As a result, many investors fear that being in the market means they are betting on a particular election outcome.
This report provides relief to that concern as does our report on 5 Stocks to Own Regardless of the Election. This report focuses on stocks that investors, and particularly those with fiduciary responsibilities, should avoid regardless of the election results.
These five stocks are Wayfair Inc. (W: $274/share), Carvana Co. (CVNA: $208/share), Beyond Meat (BYND: $162/share), Dropbox Inc. (DBX: $19/share), and Spotify Technology (SPOT: $287/share), and were recently featured in our Most Dangerous Stocks for Fiduciaries themed reports, and are back in the Danger Zone. See Figure 1.
Avoid These Highly Overvalued Stocks
Fiduciaries need to consider how much risk they take by owning these stocks anywhere close to current levels.
Figure 1: 5 Stocks to Avoid Regardless of Election Outcome
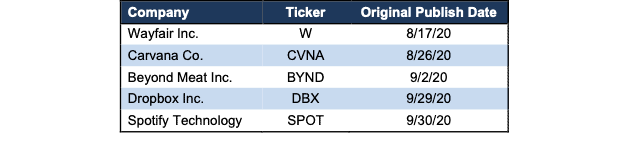
Sources: New Constructs, LLC and company filings.
These five stocks are not only overvalued, but the underlying fundamentals are weak and/or trending in the wrong direction. Each company also shares the following traits, which make them bad stocks regardless of the election:
- Negative or falling core earnings
- Inferior return on invested capital (ROIC), NOPAT margin and/or invested capital turns compared to peers
- Lack of defensible moat
- Stock valuations that imply they will achieve huge market share gains, in some cases more than the total addressable market (TAM)
Below, we highlight the competitive issues facing each firm, which will not disappear once the election is over, along with the abnormally high cash flow expectations baked into their respective stocks.
Wayfair Inc. (W) – Unattractive Rating
Read the entire report here: This Online Retailer Is Furnishing Investors With Risk
We put Wayfair in the Danger Zone on August 17, 2020. Since then, stock is down 13% while the S&P 500 is +1%. Given the strength of its competitors, the stock could fall much further.
Wayfair’s end game, particularly as COVID-19 drove consumers inside and increasingly online for their shopping, is to grab market share and achieve economies of scale. This strategy is not affected by election outcomes. Up to this point, it should have resulted in decreased operating expenses relative to revenue, greater efficiencies, and, therefore, profits. But, it has not and will not no matter who wins next week.
Competitors, With Greater Scale, Don’t Disappear Post Election
Wayfair competes against firms that have, perhaps, the largest economies of scale advantages ever: Amazon (AMZN) and Walmart (WMT). Those firms generated a combined TTM revenue of ~$864 billion compared to Wayfair’s $11.5 billion.
Worse yet, Wayfair’s business shows no signs of achieving economies of scale any time soon. The firm’s operating expenses as a percent of revenue rose from 28% in 2015 to 39% TTM. For all the talk about the firm’s revenue growth, its operating expenses are growing even faster. Over the past four years, its operating costs have grown 49% compounded annually while its revenue has grown by only 42% compounded annually. In other words, as Wayfair gets bigger, its business grows more costly.
Despite the competitive disadvantages, as evidenced by Wayfair’s negative NOPAT margin and ROIC, the stock is still priced as if it will immediately achieve profitability and grow faster than Amazon did as it rose to dominance.
Still Priced to Outpace Amazon’s Growth Trajectory
Wayfair’s current economic book value, or no growth value, is -$89/share. But, let’s see what the price looks like if we give the firm credit for being able to grow into a profitable enterprise. Below we’ll use our reverse discounted cash flow (DCF) model to analyze the expectations implied by the current valuation.
Doing so reveals that despite falling 13% since our original article, deteriorating fundamentals, and more profitable competition, Wayfair is still priced as if it will grow even faster than Amazon after it became profitable.
To justify its current price of ~$274/share, Wayfair must:
- Grow revenue by 23% compounded annually for the next decade, which includes 84% YoY growth in 2020 (equal to 2Q20 YoY increase vs. 2020 consensus of 52%) .
- Immediately achieve a 2% NOPAT margin (vs. -4% TTM) in 2020 and 2021 and increase NOPAT margin to 4.6% (equal to Amazon’s TTM NOPAT margin) in 2022 and each year thereafter.
See the math behind this reverse DCF scenario. In this scenario, Wayfair’s revenue in 2029 would reach $74.5 billion, which is just below Target (TGT) and Lowe’s (LOW) TTM revenue ($84.7 & $80.4 billion, respectively), and nearly three times the combined TTM revenue of eBay (EBAY) Bed, Bath & Beyond (BBBY), Williams-Sonoma (WSM), and Overstock.com (OSTK). Ten years after it first reached profitability, Amazon’s revenue was just $48.1 billion, or 35% below Wayfair’s implied 2029 revenue.
Figure 2 shows the revenue growth expectations baked into the stock price compared to Amazon’s revenue growth from 2001 to 2011. In this scenario, Wayfair will achieve positive NOPAT in 2020 (vs. -$480 million TTM). We chose to compare Wayfair against Amazon’s performance from 2001 to 2011 since this period represents the first ten years of Amazon achieving positive NOPAT.
Figure 2: Revenue Growth Implied by Wayfair’s Stock Price
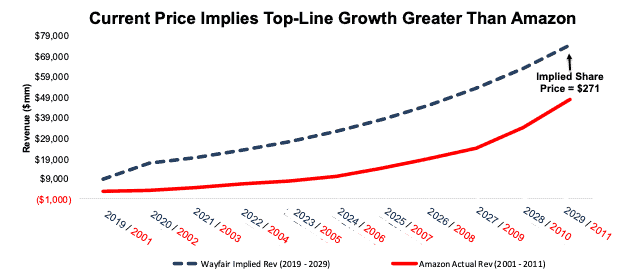
Sources: New Constructs, LLC and company filings.
In this scenario, Wayfair’s NOPAT reaches $3.4 billion (vs.-$480 million TTM) in 2029 or ~10 years. For comparison, Amazon needed 16 years to generate over $3 billion in NOPAT after it first achieved profitability.
Figure 3 compares the firm’s implied future NOPAT in this scenario to Amazon’s actual NOPAT from 2001 to 2011 (Amazon’s first ten years of profitability). This scenario assumes Wayfair will achieve profitability for the first time ever in 2020 like Amazon did in 2002. In any scenario worse than this one, W holds significant downside risk.
Figure 3: NOPAT Growth Implied by Wayfair’s Stock Price
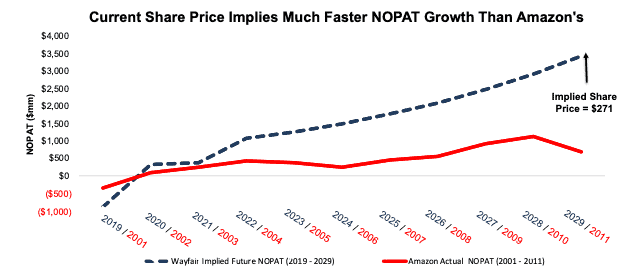
Sources: New Constructs, LLC and company filings.
Significant Downside in a More Realistic Scenario
Given the competitive issues outlined above and in our original report, we believe the future cash flow scenario above is highly unlikely (regardless of the election), if not impossible for Wayfair to achieve.
Even if we assume Wayfair can achieve Walmart’s profitability and grow revenue by consensus estimates, W has significant downside risk. In this scenario, Wayfair must:
- Achieve 18% compounded annual revenue growth for the next 10 years (equal to consensus through 2029).
- Immediately achieve a 3% NOPAT margin (equal to Walmart’s TTM margin).
See the math behind this reverse DCF scenario. In this scenario, Wayfair grows NOPAT from -$885 million in 2019 to $1.4 billion 10 years from now and the stock is worth just $98/share today – a 64% downside. For comparison, Amazon grew NOPAT from -$348 million in 2001 to $705 million a decade later. In other words, this scenario expects that over the next ten years, Wayfair will achieve significantly greater growth in NOPAT than Amazon during its first 10 years of profitability.
Figure 4 compares the firm’s implied future NOPAT in this scenario to its historical NOPAT.
Figure 4: Wayfair Has Large Downside Risk: DCF Valuation Scenario
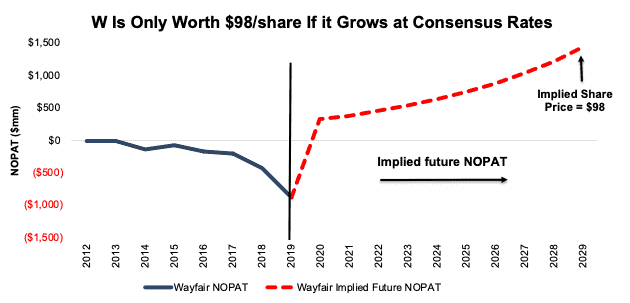
Sources: New Constructs, LLC and company filings.
Carvana Co. (CVNA) – Unattractive Rating
Read the entire report here: You Won’t Find a Bargain With This Car Dealer
We featured Carvana as a Sell Idea on August 26, 2020. Since then, the stock is flat while the S&P 500 is down 3%. Given the firm’s lack of competitive advantage, we think shares could fall much further.
For investors believing in Carvana as the “future of used automobiles” the election won’t provide any solutions to the firm’s fundamental problems. Carvana’s issues are not a matter of policy or tax status, but rather a lack of sustainable competitive advantage in a highly competitive industry.
Carvana Is Not Unique, Nor is E-commerce
Carvana’s “new” way of doing business is more style than substance and is easily replicated by incumbents. CarMax (KMX) already sells cars online and has customers sign the final paperwork upon arrival (same as Carvana). Penske Automotive Group (PAG) offers consumers tools to research the firm’s inventory within a specified mileage radius. Firms such as TrueCar (TRUE) already partner with dealerships to offer inventory on the internet as well.
Carvana, at its core, is a car dealership that, like all other dealers, must source vehicles, manage inventory, attract customers, and sell cars for more than they paid for them.
No matter the election outcome, the basic structure of Carvana’s business model, along with its industry-low NOPAT margin and ROIC, remain unchanged. However, the firm is priced as if it will sell more than double the number of cars the CEO expects, which illustrates the high level of risk in owning CVNA.
No Election Result Helps Carvana Achieve the Expectations Implied by Its Price
Despite a clear lack of competitive advantages, as outlined above and in more detail in our original report, Carvana is priced as if it will grow 5x larger than CarMax (KMX), which is the current largest used car dealer in the U.S.
To justify its current price of ~$208/share, Carvana must:
- Grow revenue at 41% compounded annually over the next decade (vs. consensus estimate of 29% CAGR over the same time).
- Immediately achieve a 4% NOPAT margin (equal to peer group average TTM margin). For reference, Carvana’s TTM margin is -9%.
See the math behind this reverse DCF scenario. In this scenario, Carvana’s revenue in 2029 would reach $122 billion, which is 119% of the combined TTM revenue of each of the competitors listed in our original report.
Last year, Carvana generated a total of $3.9 billion in revenue and sold 217 thousand combined retail and wholesale vehicles – or $18 thousand in revenue per unit sold. Assuming inflation of 3.5% per year, revenue per unit sold in 2029 would be ~$26 thousand, at which point, the firm would need to sell ~4.7 million retail and wholesale vehicles to achieve $122 billion of revenue.
Such a high number would probably shock even Carvana’s optimistic CEO, Ernest Garcia III, who stated last year, “we believe we can sell two million cars per year.” Not only does the current price imply the firm sells more than twice the number of cars the CEO expects, it also implies the firm takes over 9% of the current market share. For reference, CarMax, the largest used car dealer in the U.S., holds just 2% of the market.
Figure 5 shows the NOPAT growth expectations baked into the stock price compared to the firms historical NOPAT.
Figure 5: Carvana’s NOPAT Growth Implied by Stock Price
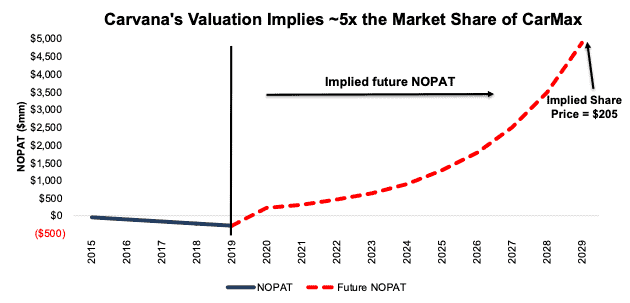
Sources: New Constructs, LLC and company filings.
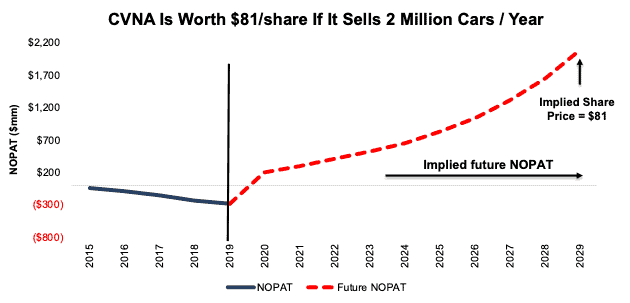
Significant Downside Even If the CEO Is Right
Even if we assume Carvana can achieve the CEO’s goal of becoming a 2 million car per year firm, CVNA has significant downside risk. In this scenario, Carvana must:
- Grow revenue by 30% compounded annually for the next decade.
- Immediately achieve a 4% NOPAT margin (equal to peer group TTM margin)
See the math behind this reverse DCF scenario. In this scenario, Carvana grows NOPAT from -$272 million in 2019 to $2.1 billion 10 years from now and the stock is worth just $81/share today – a 62% downside. In this scenario, the firm grows revenue to $52 billion in 2029. If we assume, as we did in the previous scenario, that Carvana will generate ~$26 thousand per car sold in 2029, then the firm reaches its 2 million car per year goal a decade from now.
Figure 6 compares the firm’s implied future NOPAT in this scenario to its historical NOPAT.
Figure 6: Carvana Has Large Downside Risk: DCF Valuation Scenario
Sources: New Constructs, LLC and company filings.
Beyond Meat (BYND) – Very Unattractive Rating
Read the entire report here: Competition Will Eat This Firm Alive
We featured Beyond Meat as a Sell Idea on September 2, 2020. Since then, the stock is up ~25% while the S&P 500 is down 5% despite no fundamental improvement in the firm’s operations. While the stock has underperformed as a short and may continue to do so in the short term, Beyond Meat’s business faces significant competition and the stock holds substantial downside risk. No election result changes these facts.
Meat and consumers’ preference for a type of meat will not be affected by the election. On the other hand, the large and growing body of competition makes it nearly impossible for the company to achieve the expectations baked into its stock price.
Well-Funded Competition Is Here to Stay, Regardless of the Election
Attracted by Beyond Meat’s impressive growth rates and soaring market value, multiple competitors are entering the alternative meat industry. Tyson Foods (TSN), the largest meat producer in the U.S., sold its stake in Beyond Meat in April 2019 and just a few months later announced the launch of its plant-based protein brand, Raised & Rooted. Some of the largest consumer food brands, such as Kellogg (K), SYSCO Corp. (SYY), The Kroger Co. (KR), Nestle (NSRGY), ConAgra Foods (CAG), Hormel (HRL), Kraft Heinz (KHC), and Impossible Foods have followed suit.
Unfortunately, Beyond Meat’s profitability ranks at the bottom of this group.
Additionally, many of these competitors enjoy key competitive advantages based on their multi-year relationships with grocery stores and retailers, such as captive shelf space, production and distribution scale, marketing and advertising capacity, and strong brands.
These advantages are very important and very difficult, if not impossible, for new entrants like Beyond Meat to match or overcome in the near term, if ever. As a result, Beyond Meat must spend heavily (operating expenses as a % of revenue are the highest of nine firms in our original report) simply to gain exposure to consumers. Meanwhile, other competitors can reinvest profits from traditional meat products into competing alternatives and enter the market with unmatched scale and distribution.
No election result can remove the superior scale of Beyond Meat’s peers, nor the investment required to reach such a level. As a result, the firm’s ability to achieve the expectations baked into its stock price don’t look promising.
The Election Won’t Help Beyond Meat Alter the Entire Meat Industry
With low margins and little control over the majority of distribution outlets, we think shares can fall sharply from current levels. When we use our reverse DCF model to analyze the expectations implied by the stock price, BYND appears significantly overvalued.
To justify its current price of ~$162/share, Beyond Meat must immediately improve its NOPAT margin to 5% (same as Tyson and more than double its current margin of 2%) and grow revenue by 38% compounded annually for the next 12 years. The margin improvement means NOPAT would grow 43% compounded annually in this scenario. See the math behind this reverse DCF scenario.
In this scenario, Beyond Meat would earn ~$14 billion (more than MarketsandMarkets’ 2019 estimated global plant-based meat market size of $12.1 billion) in revenue in 2031. For comparison, this scenario implies Beyond Meat would generate more sales than incumbent competitors such as Pilgrim’s Pride (PPC), ConAgra Foods (CAG), and Hormel Foods (HRL) in their last fiscal years.
Furthermore, Beyond Meat’s current valuation implies it will generate sales equal to 33% of Tyson’s 2019 revenue – a level that would make it the sixth largest meat and poultry processor in the world in 2019. See Figure 7 for details.
Figure 7: Current Valuation Implies Significantly Greater Revenue Than Many Incumbents
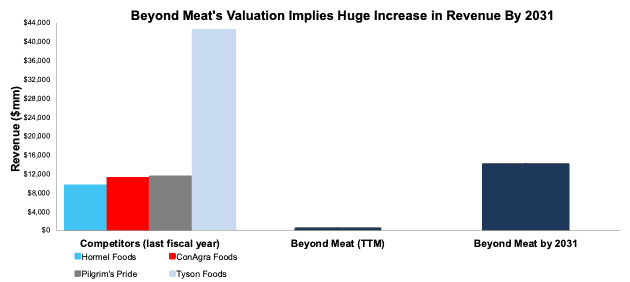
Sources: New Constructs, LLC and company filings.
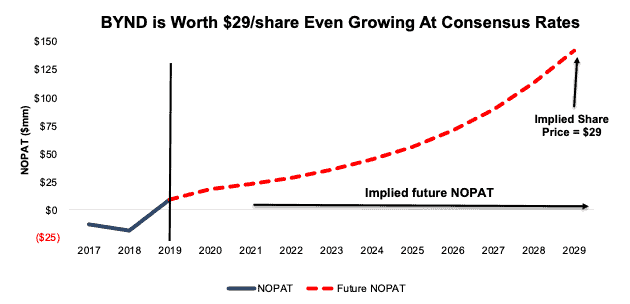
Significant Downside Even if Beyond Meat Meets Consensus Expectations
Even if Beyond Meat can improve its NOPAT margin to 5% (equal to Tyson’s TTM margin) and grow revenue by 26% compounded annually over the next decade (equal to consensus estimates), the stock is worth just $29/share today – an 82% downside to the current price. In this scenario, Beyond Meat grows NOPAT by 32% compounded annually over the next decade. See the math behind this reverse DCF scenario.
Figure 9 compares the firm’s implied future NOPAT in this scenario to its historical NOPAT.
Figure 9: BYND Has Large Downside Risk: DCF Valuation Scenario
Sources: New Constructs, LLC and company filings.
Dropbox Inc. (DBX) – Very Unattractive Rating
Read the entire report here: There’s a Dark Cloud on the Horizon
We put Dropbox in the Danger Zone on September 29, 2020. Since then, stock is down 1% while the S&P 500 is up 2% and has more downside.
The problems facing Dropbox’s business are not related to politics. Nothing in either party’s plans can help the firm attract more paying users, increase the usefulness of its product, or stave off competition from the likes of Google (GOOGL), Microsoft (MSFT), Apple (AAPL), Amazon, and Box (BOX).
Instead, regardless of the election, the firm’s inability to grow market share during the COVID-19-induced work-from-home expansion looks more likely to continue.
No Matter the President, Dropbox Is at a Competitive Disadvantage
As a standalone cloud storage provider (which is trying to expand into workflow optimization and other enterprise markets), Dropbox faces an uphill battle to grow registered and paying users. Most of its potential paying users are already customers of firms that provide the same service as Dropbox along with many other important services. As we showed in our original report, Dropbox’s user base pales in comparison to Google, Apple, and Microsoft.
Furthermore, Dropbox is at a stark disadvantage when going head-to-head with these providers. For instance, Apple offers all of its customers 5 GB of free space through iCloud, and these customers may find Apple’s new Apple One subscription (which bundles iCloud, Music, TV, Arcade, Fitness, and News) more appealing than a third-party cloud service. Dropbox not only has to convince customers not to use Apple’s more convenient and competitively-priced service, but it also must convince them that Dropbox’s service is meaningfully better.
Lastly, Dropbox offers neither the most storage nor the cheapest storage (excluding free tiers). In fact, each of the competitors in our original report offer more storage at the free tier.
Having to charge users for services they can get free from competitors is not a good position especially when those users have already integrated their workflow with those competitors. No election result can magically fix those problems. Taken together, the issues Dropbox faces make achieving the expectations baked into the firm’s stock price improbable, to say the least.
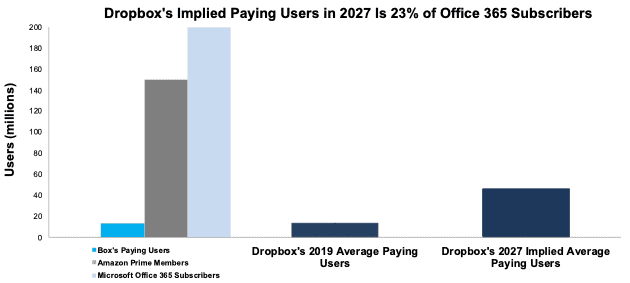
Dropbox Is Priced as if Paying Users Will Be Equal to 31% of Amazon Prime Members
Despite facing larger and more entrenched competition, Dropbox is priced as if it will quickly improve profitability while also increasing its average paying users to equal 30% of Amazon’s Prime members.
To justify its current price of $19/share, Dropbox must:
- Grow revenue at 17% (vs. average consensus estimates from 2020 to 2022 of 12%) compounded annually over the next eight years.
- Immediately achieve a 7% NOPAT margin (vs. Amazon’s TTM margin of 5%).
See the math behind this reverse DCF scenario. In this scenario, Dropbox’s revenue reaches $5.8 billion in revenue in 2027, or nearly eight times more than the $737 million of revenue Box generated over the TTM.
To illustrate the extraordinarily high growth expectations embedded in Dropbox’s stock price, we compare Dropbox’s implied paying users to the paying users of competitors. By dividing the implied revenue in 2027 of $5.8 billion by the firm’s 2Q20 ARPU of $126, we arrive at ~46 million implied paying users in 2027.
In other words, DBX’s current valuation implies the company will grow its paying user base to equal 31% of Amazon Prime members and 23% of Microsoft Office 365 subscribers today. 46 million paying users also translates to 2.6% of the global cloud storage market share.
We think it is difficult to make a straight-faced argument that Dropbox can maintain that level of market share with a more expensive and less integrated product.
Figure 10: Dropbox’s Implied 2027 Average Paying Users vs. Competitors
Sources: New Constructs, LLC and company filings.
Dropbox Has Significant Downside Assuming Consensus Growth
If we assume more realistic revenue and profit growth, DBX has significant downside.
In this scenario, we assume Dropbox will:
- Grow revenue at 11% (equal to 2021 consensus estimate) compounded annually over the next ten years.
- Immediately achieve a 4% NOPAT margin (double TTM margin of 2%).
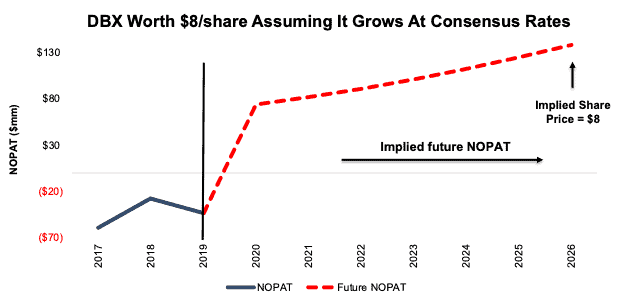
See the math behind this reverse DCF scenario. In this scenario, Dropbox grows NOPAT from -$43 million in 2019 to $189 million in 2029, and the stock is worth just $8/share – a 58% downside.
Figure 11 compares the firm’s implied future NOPAT in this scenario to its historical NOPAT.
Figure 11: DBX Has Large Downside Risk: DCF Valuation Scenario
Sources: New Constructs, LLC and company filings.
Spotify Technology (SPOT) – Unattractive Rating
Read the entire report here: It Sounds Like This Market Leader Is in Trouble
We made Spotify Technology a Sell Idea on September 30, 2020. Since then, stock is up 19% while the S&P 500 is up 1% despite no fundamental improvement to the business’ operations.
As with each of the firms above, Spotify faces strong competition from other tech firms. Plus, its heavy dependence on the Big Three music labels is not affected by any election result. The bottom line is that the firm has little to no defensible moat, and its original content strategy is risky and expensive while offering no guarantee to grow market share.
No Election Can Help Spotify Grow Market Share
As noted in our original report, Spotify’s competitors include Apple, Amazon, and YouTube, each of which have larger music catalogs than Spotify’s and have gained market share since 2018. Meanwhile, Spotify’s market share has fallen over the same time. Spotify struggles to maintain market share because it offers mostly the same product as its competitors.
In an attempt to differentiate, Spotify is investing more in proprietary content via exclusive deals with artists and a growing collection of podcasts. However, this strategy risks leading to an ever-growing content budget that is not matched by commensurate growth in subscription revenue. So far, the podcast strategy appears to be more hype than a revenue driver. In 2Q20, an estimated 79% of monthly active users (MAUs) did not listen to podcasts. By and large, Spotify is a music streaming service, facing stiff competition, and reliant upon third-parties for the majority of the content subscribers will pay for.
No election outcome will change the structural disadvantages that Spotify must overcome to justify the huge profit growth expectations baked into its stock price.
Spotify Is Priced to Be Bigger Than Netflix
Despite facing significant competition, declining ARPU, and a costly exclusive content strategy, Spotify is priced as if it will quickly improve profitability while increasing its revenue beyond what even Netflix generated over the TTM.
To justify its current price of $287/share, Spotify must:
- Grow revenue by 23% compounded annually for the next seven years (compared to consensus estimates for 16% revenue CAGR over the same time).
- Immediately achieve a 10% NOPAT margin (twice Amazon’s TTM margin of 5% and less than Sirius XM’s 18%, which is boosted by its monopoly in satellite radio. For reference, Spotify’s TTM NOPAT margin is -3%.
See the math behind this reverse DCF scenario. In this scenario, Spotify’s revenue in 2026 would reach $32.3 billion, or four times greater than exclusive satellite radio provider SiriusXM’s (SIRI) 2019 revenue.
In this scenario, Spotify’s implied revenue in 2026 equals 71% of MIDIA’s 2026 global streaming music revenue forecast of $45.3 billion and is actually 1.4 times greater than the $22.6 billion of revenue Netflix generated over the TTM. Achieving a 70% share of the global streaming music market is a very large expectation especially considering that the firm must do so in direct competition with large, established companies such as Apple, Google, and Amazon.
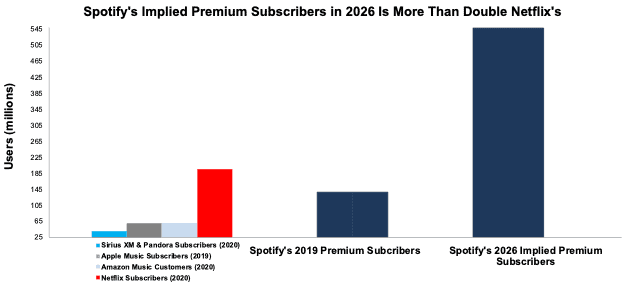
To illustrate the extraordinarily high growth expectations embedded in Spotify’s stock price, we compare Spotify’s implied premium subscribers to the paying subscribers of its competitors. By dividing the implied revenue in 2026 of $32.3 billion by the firm’s 2Q20 ARPU of ~$59, we arrive at ~547 million implied paying users in 2026.
In other words, Spotify’s current valuation implies the company will grow its paying user base to more than 13 times Sirius XM’s, nine times Apple Music’s, and nearly three times Netflix’s, per Figure 12.
Figure 12: Spotify’s Implied 2026 Premium Subscribers vs. Competitors
Sources: New Constructs, LLC and company filings.
Spotify Has Significant Downside Assuming Consensus Growth
Spotify’s current economic book value, or no growth value, is -$16/share. But we can see what the price looks like if we give the firm credit for being able to grow at consensus estimates.
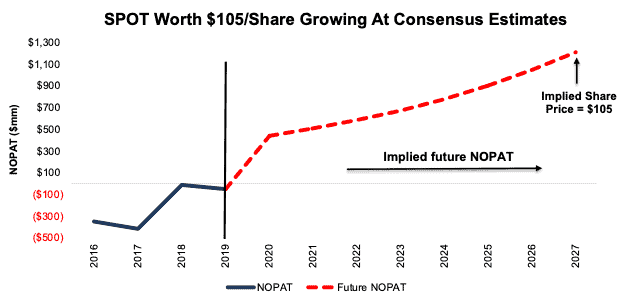
If we assume Spotify can immediately achieve a 5% NOPAT margin (equal to Amazon’s TTM margin) and grow revenue by 16% compounded annually over the next eight years (equal to consensus estimate over the same time), the stock is worth just $105/share today – a 63% downside to the current price. See the math behind this reverse DCF scenario. In this scenario, Spotify grows NOPAT from -$50 million in 2019 to $1.2 billion in 2027.
Figure 13 compares the firm’s implied future NOPAT in this scenario to its historical NOPAT.
Figure 13: SPOT Has Large Downside Risk: DCF Valuation Scenario
Sources: New Constructs, LLC and company filings.
The Importance of Reliable Fundamental Data In Any Market Environment
In times of uncertainty, whether due to economic conditions, upcoming elections, or any other situation, it pays to incorporate accurate fundamentals into investment decision making. Having access to reliable data can reveal situations where the market has overly pessimistic expectations of fundamentally strong companies, or overly optimistic expectations of firms with inferior profitability and competitive disadvantages.
It’s important that investors make decisions based on the best data available. Our Company Valuation Models incorporate all the data from financial filings to truly assess whether a firm is under or overvalued, get an accurate representation of the risk/reward of a stock, and make more informed investment decisions (rather than blindly allocating to indexes). For Wayfair Inc., Carvana Co., Beyond Meat, Dropbox Inc., and Spotify Technology the risk/reward looks poor.
This article originally published on October 28, 2020.
Disclosure: David Trainer, Kyle Guske II, and Matt Shuler receive no compensation to write about any specific stock, sector, style, or theme.
Follow us on Twitter, Facebook, LinkedIn, and StockTwits for real-time alerts on all our research.