
At this point we sound like a broken record, but, once again, the market is reaching new highs. The catalyst this time? November’s inflation data released Wednesday morning was in-line with expectations, which increases the likelihood of an additional interest rate cut next week.
Markets, especially the meme-stock heavy NASDAQ, bounced from the jump, with big names such as Apple, Amazon, Meta, Alphabet, and Tesla all reaching record highs. At the time of this writing, the NASDAQ had crossed 20,000 for the first time ever. Soaring prices are great for traders and speculators, the kind that move in and out of positions quickly and drive up trading volumes.
However, for long-term investors, those looking to find good companies at good valuations, soaring stocks makes finding real value more difficult.
Investors should be careful not to get caught up in the hype.
This week’s Danger Zone pick has directly benefited from the market hype and speculative trading in both equities and cryptocurrencies. In fact, its stock is up nearly 200% this year alone. The problem is that this move is not supported by the fundamentals of the business.
Investors thinking now’s the time to buy might want to think again. After the run up, this stock presents a perfect example of priced for perfection and more as the implied expectations for future profit growth look nearly impossible to achieve.
We first put Robinhood (HOOD: $40/share) in the Danger Zone on July 15, 2021 prior to its IPO and later named it a Zombie Stock in August 2022. Our thesis highlighted the firm’s slowing growth, lack of scale, conflicted business model, more profitable competition, and overvalued stock price.
Since our original Danger Zone report HOOD has outperformed as a short by 39%, falling 2% compared to a 37% gain for the S&P 500.
Figure 1: Danger Zone Outperformance From IPO Through 12/10/24
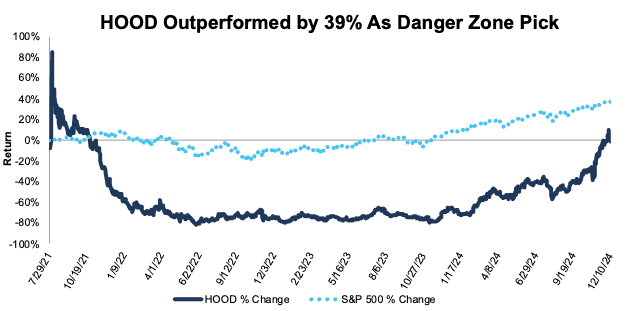
Sources: New Constructs, LLC
When we named Robinhood a Zombie Stock, its free cash flow (FCF) burn was worsening, and it had enough cash to sustain the current burn for only 20 months.
Today, Robinhood has successfully capitalized on booming investor demand for options and cryptocurrency to generate positive FCF in three of the past four quarters and over the trailing-twelve-months (TTM) ended 3Q24. As a result, Robinhood no longer qualifies as a Zombie Stock, but that doesn’t mean it’s a stock with good risk/reward, especially as it has increased nearly 200% year-to-date (YTD). In fact, the rise in valuation is a big reason why this stock remains in the Danger Zone.
What’s Working for the Business
The spike in demand for options and cryptocurrency trading has boosted Robinhood’s revenues. From 2021 through the TTM ended 3Q24, Robinhood grew revenue 10% compounded annually. At the same time, the company has successfully incentivized investors to move assets to its platform through IRA match on annual contributions. From 2021 through 3Q24, Robinhood grew assets under custody (AUC) from $98 billion to $152.2 billion and funded customers from 22.7 million to 24.3 million.
The company also substantially cut general and administrative expenses to lower operating expenses as a percent of revenue from 140% in the nine months ended September 30, 2023 to 74% of revenue in the nine months ended September 30, 2024. The decline in expenses helped Robinhood improve its net operating profit after-tax (NOPAT) margin from 17% in 2023 to 32% in the TTM ended 3Q24.
These improvements are substantial, to be sure, and the stock price has soared. However, the rise in share price went well beyond what was warranted by the fundamentals of the business.
What’s Not Working for the Business
The improvement in Robinhood’s business still leaves the company as a small player in a market filled with giants. Traditional peers such as Charles Schwab (SCHW), Fidelity, and Interactive Brokers (IBKR) also achieved significant growth in brokerage assets and client accounts over the past few years, so much so that Robinhood remains at the bottom of the pack.
Per Figure 2, Robinhood’s $152 billion in assets under custody, or the assets held by brokerage accounts on the platform, sit well below Fidelity, Charles Schwab, and Interactive Brokers. Additionally, Robinhood’s number of customer accounts are lower than both Fidelity and Charles Schwab.
Figure 2: Brokerage Comparison: Robinhood vs. Peers
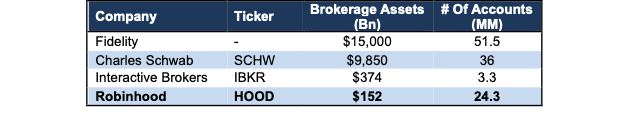
Sources: New Constructs, LLC and company filings.
All is Well in a Booming Market – As Long as You Keep Trading
In our original report we argued that Robinhood needed to significantly increase its brokerage assets to build a base source of interest revenue in the event that payment for order flow (PFOF) was ever banned or diminished.
The company has successfully grown its assets under custody, as noted above, and transaction-based revenues, such as PFOF, represent a smaller portion of the company’s total revenues than in the past. However, transaction-based revenues remain a much larger portion of the company’s revenue relative to peers, which means Robinhood’s revenue growth is much more reliant on increased trading activity. The company admits as much in its 3Q24 10-Q:
“Our transaction-based revenue is sensitive to and dependent on trading volumes and therefore tends to decline during periods in which we experience decreased levels of trading generally.”
Through the first nine months of 2024, transaction-based revenues made up 50% of Robinhood’s total net revenue.
For reference, Charles Schwab’s trading revenue, which includes commissions, order flow, and principal transactions, make up 17% of the company’s net revenue over the same time. Order flow alone makes up just 8% of Charles Schwab’s net revenues in the first nine months of 2024. Interactive Brokers’ total non-interest income, which includes commissions and order flow payments, was 38% of revenue in the first nine months of 2024.
Growing trading volumes on the platform is easier during a booming market, as investors chase returns and hype. However, if/when the market turns, and investors become more defensive and selective of their trading activity, Robinhood would be more directly impacted than its peers.
Valuation Implies Robinhood Will Have More Customers Than Schwab, Fidelity & IBKR Combined
Despite the positives listed above, Robinhood’s valuation remains the biggest risk to any new or current investors.
Below, we use our reverse discounted cash flow (DCF) model to analyze the future cash flow expectations baked into Robinhood’s stock price. Our model shows that Robinhood’s stock is priced as if the business will grow its funded customers to more than the combined customers of Fidelity and Charles Schwab while also further improving profitability and growing revenue above market projections. We also present an additional DCF scenario to highlight the downside potential if Robinhood fails to achieve these highly optimistic expectations.
To justify its current price of $40/share, our model shows that Robinhood would have to:
- improve its NOPAT margin to 40% (above Robinhood’s TTM margin of 32%) and
- grow revenue by 27% compounded annually through 2033, which is 3.7x the projected industry growth rate through 2030.
In this scenario, Robinhood would generate $20.1 billion in revenue in 2033, which is 8.4x its TTM revenue, 2.2x Interactive Brokers’ TTM revenue, and 78% of Charles Schwab’s TTM revenue.
In this scenario, Robinhood would also generate $8.1 billion in NOPAT in 2033, which is 10.4x greater than the company’s TTM NOPAT, 2.5x Interactive Broker’s TTM NOPAT and 1.6x Charles Schwab’s TTM NOPAT.
Because Robinhood reports an average revenue per user (ARPU) metric, we can also analyze the implied number of customers Robinhood would have in this scenario. If Robinhood were to simply maintain its ARPU at $105 (annualized as of 3Q24), it would need to increase funded customers from 24.3 million as of 3Q24 to 191.8 million in 2033 to generate the $20.1 billion in revenue implied by its current stock price.
Even if the company were able to double its ARPU, the above scenario still implies its funded customers grow to 95.9 million in 2033.
For comparison, Fidelity, Schwab and IBKR only have about 91 million customers combined. Fidelity reports it has 51.5 million customers in 2Q24. Charles Schwab reports it has 36.0 million accounts as of September 30, 2024. IBKR reports it has 3.3 million client accounts as of December 1, 2024.
It’s also important to note that companies that grow revenue by 20%+ compounded annually for such a long period are “unbelievably rare”. The cash flows expectations in Robinhood’s current share price are unrealistically high, which indicates downside risk is much larger than upside potential.
80%+ Downside Even if Growth Matches Expectations
If instead we assume:
- NOPAT margin is maintained at 32% (equal to TTM) from 2024 through 2033,
- revenue grows at consensus estimates in 2024 (45%), 2025 (12%), and 2026 (10%), and
- revenue grows 10% (continuation of 2026 consensus estimates) each year thereafter through 2033, then
the stock would be worth just $13/share today – an 81% downside. In this scenario, Robinhood would still generate $6.6 billion in revenue in 2033, which is 2.7x its TTM revenue, and 73% of Interactive Brokers’ TTM revenue.
This scenario also implies Robinhood generates $2.1 billion in NOPAT in 2033, which would be 2.7x its TTM NOPAT, and 67% of Interactive Brokers’ TTM NOPAT.
If Robinhood were to maintain its ARPU at $105 (annualized as of 3Q24), this scenario implies it would have 62.9 million funded customers in 2033, which is up from 24.3 million in 3Q24. Even if the company were able to double its ARPU, this scenario still implies its funded customers grow to 31.4 million in 2033.
Figure 3 compares the company’s implied future NOPAT in these two scenarios to its historical NOPAT, along with the NOPAT of Charles Schwab and Interactive Brokers.
Figure 3: Robinhood’s Historical and Implied NOPAT: DCF Valuation Scenarios
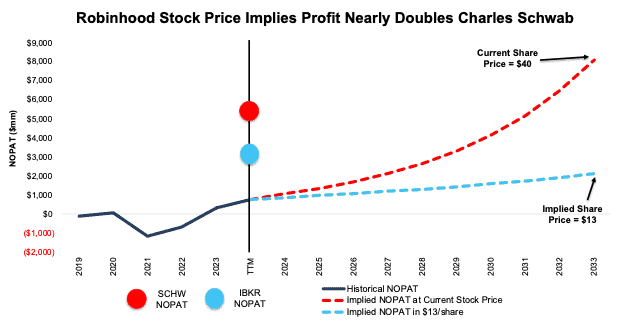
Sources: New Constructs, LLC and company filings
The Full Zombie Stock List
We started our Zombie Stock list in June 2022 and have added a total of 33 stocks to the list. After this report, 14 stocks remain on the list. Companies are removed because:
- they have extended their cash runway before running out of cash,
- their stock prices are near $0, or
- they have turned their businesses around and look like they will avoid bankruptcy.
Prior reports where we removed stocks from the Zombie Stock List are here, here, here, here, here, here, here, and here.
As a reminder, to make the Zombie Stock list, companies must:
- have less than 24 months of cash to sustain their high cash burn, and
- have a negative interest coverage ratio (EBIT/Interest expense).
Figure 4 shows all 33 Zombie Stocks. We mark those that have been removed from the list with an asterisk.
Figure 4: Zombie Stock Reports: Performance Since Publish Date Through 12/10/24
| Company Name | Ticker | Date Added | Return Since Add Date | Return as Short Vs. S&P 500 |
| Freshpet Inc.* | FRPT | 6/23/22 | -16% | 9% |
| Peloton Interactive | PTON | 6/23/22 | -14% | 68% |
| Carvana Co. | CVNA | 6/23/22 | 650% | -596% |
| Snap Inc.* | SNAP | 7/22/22 | 9% | 36% |
| Beyond Meat, Inc. | BYND | 8/1/22 | -88% | 135% |
| Rivian Automotive* | RIVN | 8/8/22 | -61% | 94% |
| DoorDash, Inc. | DASH | 8/10/22 | 123% | -80% |
| Shake Shack, Inc.* | SHAK | 8/10/22 | 112% | -75% |
| AMC Entertainment | AMC | 8/15/22 | -98% | 138% |
| GameStop Corporation* | GME | 8/15/22 | -68% | 69% |
| Chewy Inc.* | CHWY | 8/17/22 | -55% | 57% |
| Uber Technologies* | UBER | 8/17/22 | 146% | -112% |
| Robinhood Markets* | HOOD | 8/22/22 | 307% | -261% |
| Tilray Brands* | TLRY | 9/7/22 | -49% | 92% |
| Affirm | AFRM | 9/19/22 | 200% | -143% |
| Sunrun | RUN | 9/21/22 | -66% | 129% |
| Blue Apron * | APRN | 9/26/22 | -79% | 95% |
| RingCentral | RNG | 10/3/22 | -3% | 63% |
| Allbirds Inc.* | BIRD | 10/17/22 | -71% | 89% |
| Wayfair | W | 11/14/22 | 30% | 21% |
| Atlassian* | TEAM | 11/16/22 | 43% | -32% |
| Bill.com | BILL | 11/16/22 | -24% | 77% |
| Okta* | OKTA | 11/16/22 | 47% | -2% |
| Oatly* | OTLY | 11/21/22 | -62% | 71% |
| Twilio* | TWLO | 11/23/22 | 39% | 4% |
| Ceridian* | CDAY | 11/23/22 | -3% | 11% |
| Redfin | RDFN | 11/30/22 | 71% | -23% |
| Five9 Inc.* | FIVN | 12/5/22 | -37% | 72% |
| Opendoor* | OPEN | 1/30/23 | -9% | 50% |
| Compass Inc. | COMP | 2/6/23 | 63% | -18% |
| Sweetgreen Inc. | SG | 3/13/23 | 424% | -370% |
| Lucid Group* | LCID | 4/10/23 | -23% | 31% |
| Trupanion | TRUP | 5/1/23 | 56% | -9% |
| Overall Portfolio Return | 17% | 38% | ||
Sources: New Constructs, LLC and company filings.
*Stocks removed from the Zombie Stock List. Performance tracked through the date each was removed. Linked report goes to the report in which the stock was removed.
Since our first report on June 23, 2022, the Zombie Stocks have risen 17% while the S&P 500 is up 54%. See Figure 5.
Figure 5: Combined Performance of Zombie Stocks List Through 12/10/24
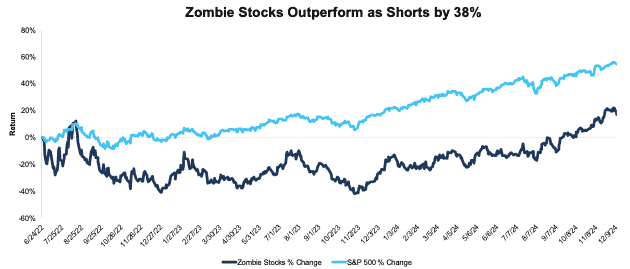
Sources: New Constructs, LLC and company filings.
This article was originally published on December 11, 2024.
Disclosure: David Trainer, Kyle Guske II, and Hakan Salt receive no compensation to write about any specific stock, style, or theme.
Questions on this report or others? Join our online community and connect with us directly.