We published an update on this Long Idea on April 28, 2021. A copy of the associated Earnings Update report is here.
Investors are ignoring this industry leader’s methodical transition into higher growth businesses and focusing solely on solvable supply chain problems. If you’re willing to look beyond the short term, you’ll find that the advantages of the firm’s size and cash flow provide resources that will contribute to many more years of profit growth. Best of all, investors have the opportunity to buy this industry leader at an historically cheap price. Intel Corporation (INTC: $49/share) is this week’s Long Idea.
Intel Has a Manufacturing Problem, Not a Design Problem
Much was made of Intel’s announcement to delay its next-generation 7nm chip until 2022. Since then, the stock has fallen 19% as many investors fear this is another example of the firm’s struggles to innovate. By comparison, AMD is up 43% since Intel’s announcement. Clearly, money has rotated out of INTC and into AMD, but is this movement justified? While the delayed rollout may hurt Intel’s sales in the short term, the firm is still positioned well for the future.
Unlike Advanced Micro Devices and NVIDIA Corporation who contract out their manufacturing process, Intel manufactures ~80% of its chips. Intel’s failure to deliver its next-generation chip on schedule is a manufacturing problem, not a problem with the chip’s technology.
Intel has already taken steps to address their immediate manufacturing issues, and is exploring contracting out more of its chips to another manufacturer to minimize supply disruptions. Additionally, Intel is reorganizing the technology side of the business, which includes the departure of its chief engineering officer. The technology group will be broken up into five smaller groups that will focus on manufacturing and design. The leader of each group will report directly to the CEO.
While the restructuring should provide more accountability within the development of the firm’s manufacturing processes, the firm’s superior ability to deploy capital into research and development give Intel plenty of resources to keep its manufacturing capabilities aligned with its chip designs in the future.
Intel’s R&D Advantage
Intel has a sizeable advantage over the competition in research and development (R&D) spending. Per Figure 1, over the last three years, Intel has spent a total of $39.9 billion on R&D while Advanced Micro Devices and NVIDIA combined for just $12.7 billion. While Intel’s new chip manufacturing troubles may put the firm behind in the short term, the firm has plenty of resources to catch up.
Figure 1: R&D Spending

Sources: New Constructs, LLC and company filings.
Intel’s Long-Term Data-Centric Transformation Is Working
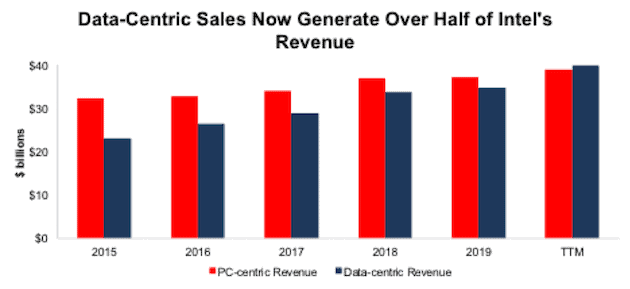
Looking beyond short-term disruptions reveals that Intel is focused on positioning its business operations for future growth. Intel is successfully transitioning from a PC-centric to a data-centric firm. Per Figure 2, Intel’s data-centric (including the firm’s data center group, internet of things group, Mobileye, non-volatile memory solutions group, programmable solutions group, and all other non-PC businesses) revenue has grown from 42% of revenue in 2015 to 51% of revenue over the TTM.
Figure 2: Data-Centric & PC-Centric Revenue Since 2015
Sources: New Constructs, LLC and company filings.
While many business transitions result in periods of low performance, as firms switch focus from declining to new businesses, Intel has managed to grow its revenue by 12% compounded annually over the past four years as it better positions itself for future growth.
The shift towards a more data-centric business puts the firm in higher growth segments of the semiconductor market. From 2017 to 2019, the global data-centric market (which includes all segments other than consumer electronics) grew 7% compounded annually while the PC-centric market grew by only 4% compounded annually.
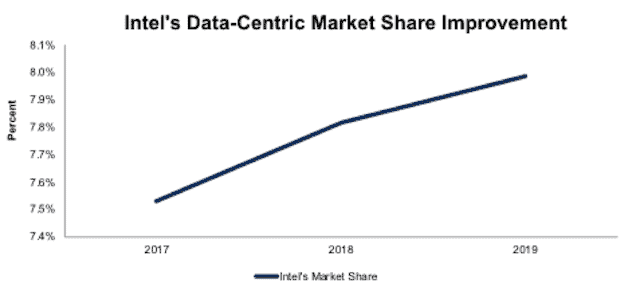
As evidence that Intel is not the lagging PC-centric company some investors may believe, the firm has maintained, and is actually growing, its share of the data-centric market. Per Figure 3, Intel’s share of the data-centric market improved from 7.5% in 2017 to 8.0% in 2019.
Figure 3: Intel’s Data-Centric Share of Non-Consumer Electronics Semiconductor Market Since 2017
Sources: New Constructs, LLC, company filings, and Statista.
PC Business Is Not Dead Either
While bears want to focus on the limited future growth in the PC market, Intel’s PC-centric business is not something to write-off. Gartner reports that PC shipments worldwide totaled nearly 65 million in 2Q20, a 3% increase over 2Q19. While growth has slowed in recent years and is expected to fall going forward (more below), the PC market still provides consistent cash flow for semiconductor firms such as Intel.
ResearchAndMarkets.com’s forecasts a 2.8% compounded annual decline in the global PC market from 2019 to 2025. In fact, last year was the first year the global PC market grew YoY in the past eight years. Even in the face of the headwinds of a declining market, Intel has grown its PC-centric revenue by 4% compounded annually since 2015.
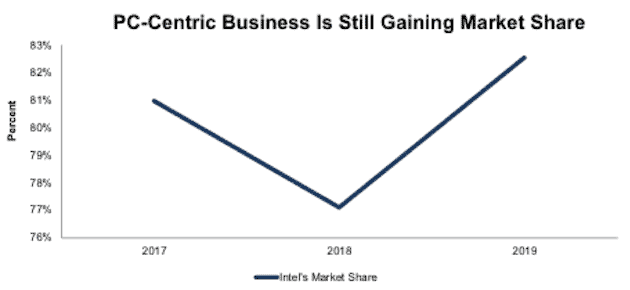
More importantly, Intel is the “elephant in the room” so to speak, as Figure 4 shows the firm’s PC-centric business already commands more than three-fourths of the consumer electronic semiconductor market and has gained share since 2018.
Figure 4: Intel’s PC-Centric Share of Consumer Electronic Semiconductor Market Since 2017
Sources: New Constructs, LLC, company filings, and Statista.
GPUs and Mobileye Are the Next High Growth Opportunities
There is still a piece of the PC-centric market where Intel has an opportunity to grow: graphics processing units (GPU). Allied Market Research, expects the GPU market to grow from $19.8 billion in 2019 to nearly $201 billion in 2027 or by 34% compounded annually.
For example, Intel is aggressively entering the discreet GPU business, which is about 80% of the current GPU market. The firm hired engineers and marketing experts from Advanced Micro Devices and NVIDIA, the market leader in the space, to assemble a team to develop and rollout the firm’s Intel Xe GPU.
Other Intel GPUs are designed for lower-performing data processing needs, but the Intel XE will be the firm’s first dedicated graphics card in twenty years. This will allow Intel to directly compete with NVIDIA and Advanced Micro Devices for more share of the GPU market.
Advanced GPU capabilities will not just make Intel’s PC-centric business more competitive, but the firm should also be able to utilize this technology in many of its data-centric businesses requiring higher powered processing such as artificial intelligence, 5G, and automated driving.
The firm’s acquisition of Mobileye strategically positions it to build out its driverless technology business as well. In just three years, Mobileye has experienced rapid growth, with revenue increasing from $210 million in 2017 to $879 million in 2019. Its share of automobile semiconductor sales increased from just 0.5% to 1.9% over the same time. If Mobileye continues taking market share in this fast-growing segment, Mobileye’s could provide a meaningful contribution to Intel’s operations, as it made up just over 1% of revenue in 2019.
ResearchAndMarkets.com expects the autonomous/driverless market to grow 18% compounded annually from 2020 to 2025. Intel is positioned to grow with this new market.
Intel Generates Huge Earnings and Free Cash Flow
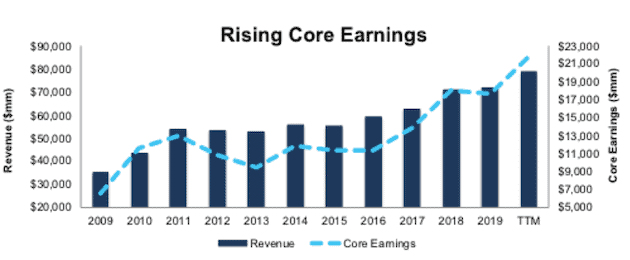
Over the past decade, Intel grew revenue by 7% compounded annually and core earnings[1] by 11% compounded annually, per Figure 5. The firm increased its core earnings margin from 19% to 28% over the same time.
Figure 5: Core Earnings & Revenue Growth Since 2009
Sources: New Constructs, LLC and company filings.
Intel’s rising profitability helps the business generate significant free cash flow (FCF). The company generated positive FCF in eight of the past 10 years and a cumulative $22.4 billion (11% of market cap) in FCF over the past five years. Intel’s $17.5 billion in FCF over the TTM period equates to an 8% FCF yield, which is significantly higher than the Technology sector average of 1%.
Creating the Most Shareholder Value
Per Figure 6, While below its peer group, Intel’s return on invested capital (ROIC) improved from 16% in 2017 to 19% TTM. The market-cap-weighted average of peers’ ROIC actually fell from 32% to 27% over the same time. Peers include Advanced Micro Devices, Inc. (AMD), NVIDIA Corporation (NVDA), Taiwan Semiconductor Manufacturing Company Limited (TSM), Broadcom Ltd (AVGO), QUALCOMM Inc. (QCOM), Texas Instruments, Inc. (TXN), and Micron Technology, Inc. (MU) and 55 other firms in the semiconductor industry.
Figure 6: ROIC vs. Semiconductor Industry Peers

Sources: New Constructs, LLC and company filings.
Figure 7 shows Intel’s ROIC performance relative to two of its main competitors, Advanced Micro Devices and NVIDIA. While NVIDIA’s ROIC is highest among the three firms, it has fallen sharply from 95% in 2017 to 66% TTM, whereas Intel’s ROIC has risen over the same time. Intel’s TTM ROIC of 19% is superior to Advanced Micro Devices’ TTM ROIC of 12%.
Figure 7: ROIC vs. Direct Competitors

Sources: New Constructs, LLC and company filings.
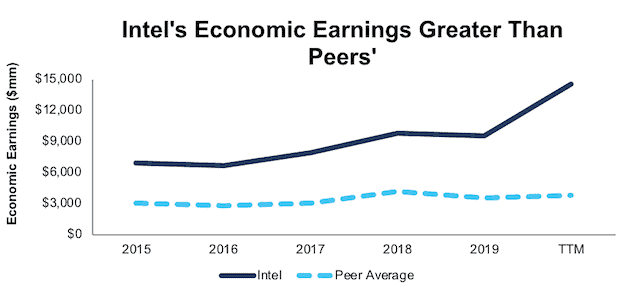
Even though ROIC is lower than the market-cap-weighted average of its peers, the firm generates the most economic earnings by a wide margin. Per Figure 4, Intel’s economic earnings rose from $6.9 billion in 2015 to $9.5 billion in 2019 or 8% compounded annually. The firm’s TTM economic earnings are $14.6 billion. The market-cap-weighted average economic earnings of the peer group only increased from $3.1 billion to $3.6 billion or 4% compounded annually from 2015 to 2019. Intel has clearly been creating more value for its shareholders than peers.
Figure 8: Economic Earnings vs. Peers
Sources: New Constructs, LLC and company filings.
Over the TTM, the cumulative economic earnings of Intel and its 63-member peer group totaled $30.2 billion. Intel’s TTM economic earnings of $14.6 billion accounts for 48% of that total.
INTC Is Undervalued
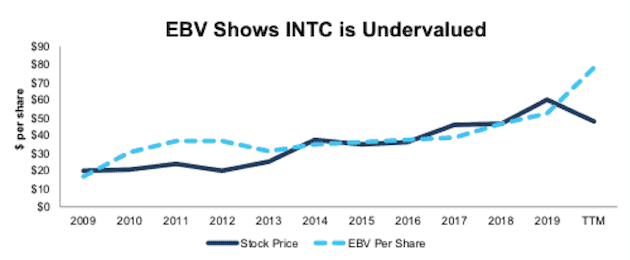
After falling 19% year-to-date (YTD) to $48/share, INTC now trades below its economic book value (EBV), or no-growth value. Its current price-to-economic book value (PEBV) ratio (0.6) is the lowest in the history of our model (which goes back to 1998), and means the market expects Intel’s NOPAT to permanently decline by 40%. This expectation seems overly pessimistic over the long term. For reference, Intel has grown NOPAT by 8% compounded annually over the past five years and 11% compounded annually over the past decade.
Figure 9 shows Intel’s economic book value is $78/share – a 63% upside to its current price.
Figure 9: Stock Price vs. Unadjusted EBV per Share
Sources: New Constructs, LLC and company filings.
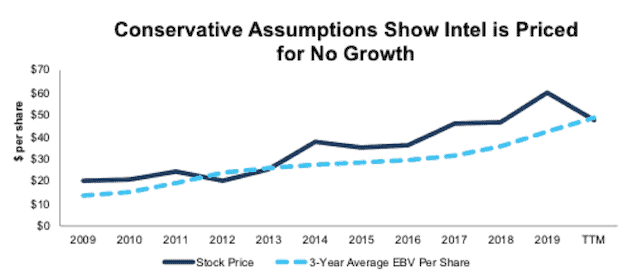
When we look at Intel’s 3-year average EBV, which helps smooth out the volatility in semiconductor cycles, and adjust for a more conservative WACC[2], the firm still looks undervalued. Its current price-to-3-year average economic book value ratio of 1.0 (which implies no future growth in profits) is the cheapest since 2013. For reference, Intel has grown NOPAT by 5% compounded annually over the past two decades and NOPAT is up 23% YoY in the TTM period.
Figure 10: Stock Price vs. 3-Year Average EBV per Share With 10-Year Average WACC
Sources: New Constructs, LLC and company filings.
INTC’s Current Price Implies Permanently Lower Profit Levels
Intel is priced as if the COVID-driven economic decline and delay in its 7nm chips will permanently depress its profits. Below, we use our reverse DCF model to quantify the cash flow expectations baked into Intel’s current stock price. Then, we analyze the implied value of the stock based on different assumptions about Intel’s future growth in cash flows.
Scenario 1: Using historical revenue declines, historical margins, and average historical GDP growth rates, we can model the worst-case scenario already implied by Intel’s current stock price. In this scenario, we assume:
- NOPAT margins fall to 19% (all-time average, compared to 28% TTM)
- Revenue grows at 2% a year, which is below the 3.5% average global GDP growth rate since 1961
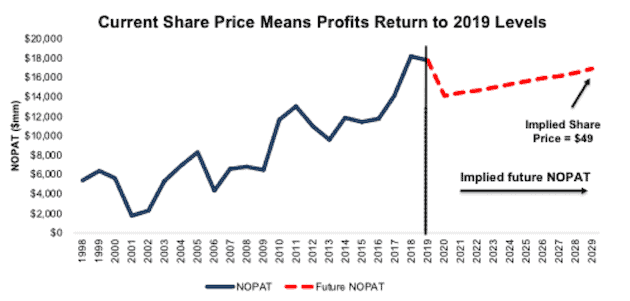
In this scenario, where Intel’s NOPAT declines 1% compounded annually over the next ten years (including a 20% drop in 2020), the stock is worth $49/share today – equal to the current stock price. See the math behind this reverse DCF scenario.
Figure 11 compares the firm’s implied future NOPAT in this scenario to its historical NOPAT. This worst-case scenario implies Intel’s NOPAT a decade from now will still be 5% below its 2019 NOPAT and 7% below its 2018 NOPAT. In any scenario better than this one, INTC holds significant upside potential, as we’ll show below.
Figure 11: Current Valuation Implies Severe, Long-Term Decline in Profits: Scenario 1
Sources: New Constructs, LLC and company filings.
Scenario 2: Long-Term View Could Be Very Profitable
If we assume Intel meets consensus revenue estimates over the next three years and grows moderately thereafter, INTC is undervalued.
In this scenario, we assume:
- NOPAT margins fall to 22% (10-year average, compared to 28% TTM)
- Revenue grows at 4.4% in 2020, -1.5% in 2021, and 5% in 2022 (consensus estimates)
- Revenue grows at 3.5% each year thereafter, which equals the average global GDP growth rate since 1961
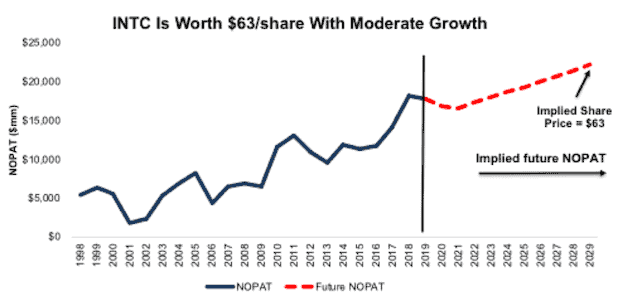
In this scenario, Intel’s NOPAT grows by 2% compounded annually over the next decade (including a 5% drop in 2020) and the stock is worth $63/share today – a 29% upside to the current price. See the math behind this reverse DCF scenario.
For comparison, Intel has grown NOPAT by 5% compounded annually over the past two decades. It’s not often investors get the opportunity to buy an industry leading company at such a discounted price.
Figure 12 compares the firm’s implied future NOPAT in scenario 2 to its historical NOPAT. This scenario implies that a decade from now, Intel’s NOPAT will be just 22% above 2018. If profits grow even faster than that, INTC has even more upside potential. For reference, Intel’s NOPAT in 2019 was over 175% higher than 2009.
Figure 12: Implied Profits Assuming Moderate Recovery: Scenario 2
Sources: New Constructs, LLC and company filings.
Sustainable Competitive Advantages Will Drive Shareholder Value Creation
Here’s a summary of why we think the moat around Intel’s business will enable it to continue to generate higher NOPAT than the current market valuation implies. The following competitive advantages help Intel survive the downturn and return to growth as the economy rebounds:
- Greater R&D spending and capacity to spent than peers
- Market leader in consumer electronic semiconductor market
- Successfully moving into higher-growth markets
- Ability to attract talent to develop new product lines
What Noise Traders Miss with Intel
These days, fewer investors focus on finding quality capital allocators with shareholder friendly corporate governance. Instead, due to the proliferation of noise traders, the focus is on short-term technical trading trends while high-quality fundamental research is overlooked. Here’s a quick summary of what noise traders are missing:
- Consistent long-term core earnings growth
- Proliferation of chips in everyday life
- Valuation implies permanent profit declines
Nearly 3% Dividend Yield Supported by Cash Flow
Firms with cash flows greater than dividend payments have a higher likelihood to maintain and grow dividends.
Intel has increased its dividend in each of the past six years. Over the past two years, the firm generated more in in free cash flow ($19.0 billion) than it paid out in dividends ($11.1 billion), or an average $3.9 billion surplus each year. Over the TTM, the firm has generated $17.5 billion in FCF while paying out $5.6 billion in dividends. Its last quarterly dividend, when annualized, equals $1.32/share and provides a 2.7% yield.
Historically, Intel has also returned capital to shareholders through share repurchases. However, the firm suspended its repurchase activity in March. Before suspending repurchases, Intel repurchased $33.5 billion (16% of current market cap) over the past five years. The firm has $12.4 billion remaining for future repurchases under its current authorization. A return to repurchasing shares once the economy stabilizes, or even returns to growth, would provide additional yield for investors.
A Consensus Beat or Signs of Recovery Could Send Shares Higher
According to Zacks, consensus estimates at the end of January pegged Intel’s 2020 EPS at $4.99/share. Jump forward to August 3 and consensus estimates for Intel’s 2020 EPS have fallen slightly to $4.85/share. 2021 estimates follow a similar trend. At the end of January, 2021 EPS consensus was $5.09/share and has since fallen to $4.93/share.
Though the firm is experiencing production issues with its next-generation chip, these lowered expectations provide a great opportunity for a strong company, such as Intel, to beat consensus. Our current Earnings Distortion Score, which is a short-term indicator of the likelihood to beat or miss expectations, for Intel is “Miss.” However, the lowered expectations moving forward make it much easier for the firm to beat earnings.
The firm beat EPS estimates in each of the past 12 quarters, and doing so again, in the midst of such turmoil, could send shares higher.
Furthermore, if Intel can resolve its production problems sooner than expected, shares could move higher.
Executive Compensation Could Be Improved but Raises No Red Flags
No matter the macro environment, investors should look for companies with executive compensation plans that directly align executives’ interests with shareholders’ interests. Quality corporate governance holds executives accountable to shareholders by incentivizing them to allocate capital prudently.
Intel’s Executive Compensation plan pays annual cash bonuses, quarterly cash bonuses, restricted stock units (RSUs), and performance stock units (PSUs).
Annual cash bonuses are tied to net income performance, relative net income growth performance, and business group specific operational goals. Quarterly cash bonuses are linked to the firm’s quarterly net income performance.
Longer term, the firm rewards executives PSUs that are tied to the three-year total shareholder return performance relative to peers and cumulative EPS.
We would prefer the firm use ROIC improvement when determining executive compensation, as there is a strong correlation between improving ROIC and increasing shareholder value. Having accurate values for NOPAT and invested capital ensures investors have an apples-to-apples metric for measuring corporate performance and holds management accountable for every dollar invested into the company.
Despite not using ROIC when measuring performance, Intel’s compensation plan has not compensated executives while destroying shareholder value. Intel has grown economic earnings by 5% compounded annually over the past five years and by 11% compounded annually over the past decade.
Insider Trading and Short Interest Trends
Over the past twelve months, insiders have bought a total of 213 thousand shares and sold 655 thousand shares for a net effect of 442 thousand shares sold. These sales represent less than 1% of shares outstanding.
There are currently 33.3 million shares sold short, which equates to 1% of shares outstanding and under two days to cover. Short interest is down 1% from the prior month. The low short interest indicates not many investors are willing to bet against this firm.
Critical Details Found in Financial Filings by Our Robo-Analyst Technology
As investors focus more on fundamental research, research automation technology is needed to analyze all the critical financial details in financial filings as shown in the Harvard Business School and MIT Sloan paper, "Core Earnings: New Data and Evidence”.
Below are specifics on the adjustments we make based on Robo-Analyst findings in Intel’s 2019 10-K:
Income Statement: we made $5.4 billion of adjustments, with a net effect of removing $3.3 billion in non-operating income (7% of revenue). You can see all the adjustments made to Intel’s income statement here.
Balance Sheet: we made $43 billion of adjustments to calculate invested capital with a net decrease of $4 billion. One of the largest adjustments was $8.8 billion in asset write-downs. This adjustment represented 8% of reported net assets. You can see all the adjustments made to Intel’s balance sheet here.
Valuation: we made $73.2 billion of adjustments with a net effect of decreasing shareholder value by $11.2 billion. Apart from total debt, one of the most notable adjustments to shareholder value was $31 billion in excess cash. This adjustment represents 8% of Intel’s market cap. See all adjustments to Intel’s valuation here.
Attractive Funds That Hold INTC
The following funds receive our Attractive-or-better rating and allocate significantly to INTC:
- iShares Edge MSCI U.S.A. Value Factor ETF (VLUE) – 9.7% allocation and Very Attractive rating
- Chestnut Street Exchange Fund (CHNTX) – 6.7% allocation and Attractive rating
- First Trust NASDAQ Technology Dividend Index Fund (TDIV) – 6.7% allocation and Attractive rating
- Davis Research Fund (DRFAX) – 6.6% allocation and Attractive rating
- Holland Balanced Fund (HOLBX) – 6.0% allocation and Very Attractive rating
- Stock Dividend Fund, Inc (SDIVX) – 5.7% allocation and Very Attractive rating
- Union Street Partners Value Fund (USPFX) – 5.2% allocation and Very Attractive rating
- BrandywineGlobal - Dynamic U.S. Large Cap Value Fund – 5.0% allocation and Very Attractive rating
This article originally published on August 6, 2020.
Disclosure: David Trainer, Kyle Guske II, and Matt Shuler receive no compensation to write about any specific stock, style, or theme.
Follow us on Twitter, Facebook, LinkedIn, and StockTwits for real-time alerts on all our research.
[1] Our core earnings are a superior measure of profits, as demonstrated in Core Earnings: New Data & Evidence a paper by professors at Harvard Business School (HBS) & MIT Sloan. The paper empirically shows that our data is superior to “Operating Income After Depreciation” and “Income Before Special Items” from Compustat, owned by S&P Global (SPGI).
[2]We utilized the override capability in our Company Valuation Model to calculate INTC’ 3-Year Average EBV using the firm’s 10-year average weighted average cost of capital (WACC) to derive a three-year average EBV that is less sensitive to any changes in WACC. This approach is especially useful in the current low interest rate environment. While we do not know where interest rates will go in the future, calculating three-year average EBV with longer-term average WACC gives a more conservative three-year average EBV in the event interest rates increase in the future.
