We hope you’ve enjoyed the many free picks we’ve given out the last several weeks. Given our track record, those picks represent a LOT of value. Even more importantly, though, our goal for giving you those free picks is for you to see the quality, rigor and diligence of our work.
Today, with this report, is the last day we’re giving out free Attractive or Very Attractive rated stock picks. We’re still going to share a few Danger Zone, Most Dangerous and Zombie stock warnings as well as some sector/industry picks, but we’re going to reserve all the Attractive and Very Attractive stocks from Model Portfolios for our paying members going forward.
For the last free Very Attractive pick, we’re ending on a high note and bringing you a free stock pick from the Exec Comp Aligned with ROIC Model Portfolio, one of our favorite Model Portfolio’s. Last month we shared a pick that was also on our Focus List Stocks: Long Model Portfolio. This month, we’re featuring a stock that has been in the Exec Comp Aligned with ROIC Model Portfolio since April 2024.
We always talk about the importance of companies aligning executive compensation with ROIC, but it is just as important to that companies calculate return on invested capital (ROIC) correctly. We recently published an article showing how far off the mark ROIC calculations from legacy firms like FactSet (FDS) and Morningstar (MORN) can be. You deserve research you can trust, and we’re the only research firm delivering proven-superior fundamental research.
What’s the point of aligning compensation with ROIC if the calculation is manipulated to look better than it truly is?
This Model Portfolio discerns between companies that calculate ROIC with rigor and those that do not. We measure how close the companies’ versions of ROIC (even if they call it by another name) are to our ROIC. The goal is to showcase companies that have quality ROIC and prioritize value creation for investors by rewarding their executives for improving ROIC, not a metric that is easily manipulated to look good no matter the true performance of the business. In our opinion, there’s not a better group of stocks out there.
This month’s featured stock earns our Very Attractive rating. As we’ll show below, the business has strong fundamentals and boasts consistent ROIC growth, yet the stock is priced as if profits will permanently decline by 10%.
The reason why we give away something so valuable is simple, yet important. It’s because:
- We want you to see our work so you know much value we deliver clients.
- We want to earn your trust.
- We hope to get your business one day.
We hope you enjoy this research. We hope you find value. Please share with family and friends if you think it would be of interest.
We update this Model Portfolio monthly, and August’s Exec Comp Aligned with ROIC Model Portfolio was updated and published for clients on August 15, 2024.
Recap from July Picks
The best performing stock in the portfolio was up 7%. Overall, 7 of the 15 Exec Comp Aligned with ROIC Stocks outperformed the S&P from July 12, 2024 through August 13, 2024.
This report leverages our cutting-edge Robo-Analyst technology to deliver proven-superior[1] fundamental research and support more cost-effective fulfillment of the fiduciary duty of care.
This Model Portfolio includes stocks that earn an Attractive or Very Attractive rating and align executive compensation with improving ROIC. This combination provides a unique list of long ideas as the primary driver of shareholder value creation is return on invested capital (ROIC).
Stock Feature for August: MSC Industrial Direct Co (MSM: $81/share)
MSC Industrial (MSM) is the featured stock in August’s Exec Comp Aligned with ROIC Model Portfolio.
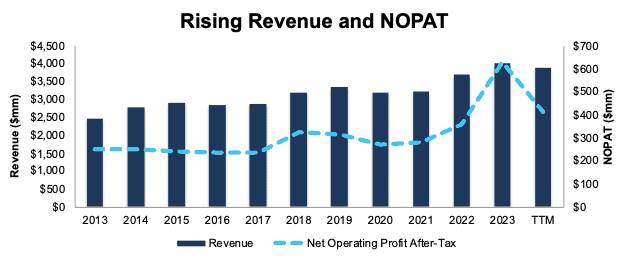
MSC Industrial has grown revenue and net operating profit after tax (NOPAT) by 4% and 5% compounded annually, respectively, since fiscal 2013. The company’s NOPAT margin improved from 10.3% in fiscal 2013 to 10.6% in the TTM. Invested capital turns rose from 1.7 to 1.8 over the same time. Rising NOPAT margins and invested capital turns drive the company’s return on invested capital (ROIC) from 17.2% in fiscal 2013 to 18.7% in the TTM.
Figure 1: MSC Industrial’s Revenue & NOPAT: Fiscal 2013 – TTM
Sources: New Constructs, LLC and company filings
Executive Compensation Properly Aligns Incentives
MSC Industrial’s executive compensation plan aligns the interests of executives and shareholders by tying 50% of its long-term incentive awards to performance stock units (PSUs), which are awarded based on average adjusted return on invested capital (ROIC) targets.
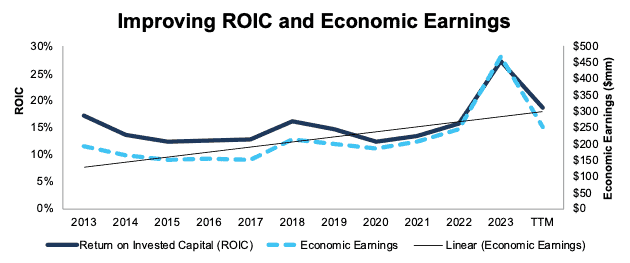
The company’s inclusion of adjusted ROIC, a variation of ROIC, as a performance goal has helped create shareholder value by driving higher ROIC and economic earnings. When we calculate ROIC using our superior fundamental data, we find that MSC Industrial’s ROIC has increased from 17% in fiscal 2013 to 19% in the TTM. Economic earnings rose from $192 million to $253 million over the same time.
Figure 2: MSC Industrial’s ROIC & Economic Earnings: Fiscal 2013 – TTM
Sources: New Constructs, LLC and company filings
MSM Has Further Upside
At its current price of $81/share, MSM has a price-to-economic book value (PEBV) ratio of 0.9. This ratio means the market expects MSC Industrial’s NOPAT to permanently fall 10% from current levels. This expectation seems overly pessimistic for a company that has grown NOPAT 4% compounded annually over the last five years and 5% compounded annually since fiscal 2013.
Even if MSC Industrial’s
- NOPAT margin falls to 10% (below TTM NOPAT margin of 11%) and
- revenue grows 3% (below the 4% CAGR over the last ten years) compounded annually through 2033 then,
the stock would be worth $104/share today – a 28% upside. See the math behind this reverse DCF scenario. In this scenario, MSC Industrial’s NOPAT would fall 2% compounded annually from 2023 through 2033.
Should the company grow NOPAT more in line with historical growth rates, the stock has even more upside.
Critical Details Found in Financial Filings by Our Robo-Analyst Technology
Below are specifics on the adjustments we made based on Robo-Analyst findings in MSC Industrial’s 10-Ks and 10-Qs:
Income Statement: we made over $475 million in adjustments with a net effect of removing over $275 million in non-operating expense. Professional members can see all adjustments made to MSC Industrial’s income statement on the GAAP Reconciliation tab on the Ratings page on our website.
Balance Sheet: we made over $430 million in adjustments to calculate invested capital with a net decrease of over $400 million. One of the most notable adjustments was several million in asset write downs. Professional members can see all adjustments made to MSC Industrial’s balance sheet on the GAAP Reconciliation tab on the Ratings page on our website.
Valuation: we made just under $700 million in adjustments to shareholder value, all of which decreased shareholder value. The most notable adjustment to shareholder value was for total debt. Professional members can see all adjustments to MSC Industrial’s valuation on the GAAP Reconciliation tab on the Ratings page on our website.
This article was originally published on August 22, 2024.
Disclosure: David Trainer, Kyle Guske II, and Hakan Salt receive no compensation to write about any specific stock, style, or theme.
Questions on this report or others? Join our online community and connect with us directly.
[1] Our research utilizes our Core Earnings, a more reliable measure of profits, as proven in Core Earnings: New Data & Evidence, written by professors at Harvard Business School (HBS) & MIT Sloan and published in The Journal of Financial Economics.


