
Check out this week’s Danger Zone interview with Chuck Jaffe of Money Life.
Through our rigorous analysis of fund holdings[1], we’ve identified a mutual fund that is Mid Cap in name only. Review of its holdings reveals more downside risk than traditional research shows. Voya Mid Cap Opportunities Fund (NMCAX) is in the Danger Zone.
Backwards Looking Research Overrates This Fund
Investors that rely solely on past performance may miss the biggest risk of investing in this fund: its poor holdings. Per Figure 1, all of the share classes of Voya Mid Cap Opportunities Fund earn the 3-Star rating from Morningstar while garnering our Very Unattractive rating, the worst of our Predictive Risk/Reward Fund ratings.
Figure 1: Voya Mid Cap Opportunities Fund Ratings
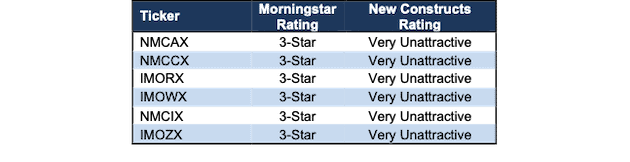
Sources: New Constructs, LLC, company, ETF and mutual fund filings, and Morningstar
NMCAX allocates significantly more capital to companies with low profitability and expensive valuations, which makes its portfolio riskier than its benchmark, iShares Core S&P U.S. Growth ETF (IUSG).
Holdings Research Reveals a Low-Quality Portfolio
Per Figure 2, Voya Mid Cap Opportunities Fund’s asset allocation poses greater downside risk and holds less upside potential than IUSG.
NMCAX allocates 50% of its portfolio to Unattractive-or-worse rated stocks compared to just 16% for IUSG. On the flip side, NMCAX’s exposure to Attractive-or-better rated stocks is much lower, at 10%, versus IUSG at 31%.
Additionally, nine of NMCAX’s top 10 holdings (25% of assets invested) earn a Neutral-or-worse rating.
Figure 2: NMCAX Allocates Capital to More Low-Quality Holdings
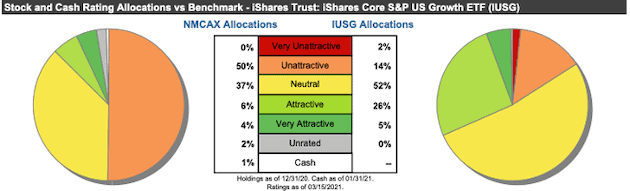
Sources: New Constructs, LLC and company, ETF and mutual fund filings
Given the unfavorable allocation of Attractive-or-better rated stocks vs. Unattractive-or-worse rated stocks relative to the benchmark, NMCAX appears poorly positioned to generate the outperformance required to justify its fees.
Easily Make Any Fund Better
As we showed in The Paradigm Shift to Self-Directed Portfolio Construction, new technologies enable investors to create their own fund without any fees while also enabling better, more sophisticated weighting methodologies. If instead of weighting by NMCAX’s method, we weight the fund’s holdings by return on invested capital (ROIC), our customized fund allocates:
- 14% of assets to Attractive-or-better rated stocks (compared to 10% for NMCAX)
- 19% of assets to Unattractive-or-worse rated stocks (compared to 50% for NMCAX).
Compare the quality of stock allocation in our customized fund vs. NMCAX here.
Unclear Active Management Strategy
In its prospectus, Voya Mid Cap Opportunities Fund outlines its strategy for choosing investments as follows:
- “normally invests in companies that the sub-adviser believes have above average prospects for growth”
- uses “…a stock selection process that combines quantitative screens with rigorous fundamental analysis”
- and seeks to identify companies’ stocks with:
- strong business momentum
- relative price strength
- a perceived value by the Sub-Adviser that is not reflected in the current price
The use of vague statements like “the sub-adviser believes” and “above average prospects” should be a red flag to investors because we have no idea what they actually mean. Managers that tend to be less transparent in their language and methodology are usually less rigorous about how they pick stocks. After all, why wouldn’t managers want everyone to know how much work goes into building a quality portfolio?
Regardless of the level of transparency, without the use of reliable fundamental data and metrics that accurately reflect profitability and valuation (e.g. Core Earnings[2], ROIC, and price-to-economic book value [PEBV]) NMCAX routinely invests in stocks with low-quality earnings, negative cash flows, and expensive valuations.
Strategy Selects Too Many Bad Stocks
Figure 3 contains our detailed rating for NMCAX, which includes each of the criteria we use to rate all funds under coverage. These criteria are the same for our Stock Rating Methodology because the performance of a fund’s holdings equals the performance of a fund after fees.
Figure 3: Voya Mid Cap Opportunities Fund Rating Breakdown
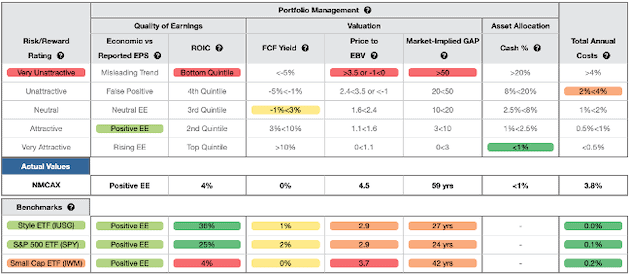
Sources: New Constructs, LLC and company, ETF and mutual fund filings
As Figure 3 shows, NMCAX’s holdings are inferior to its benchmark, IUSG, and the S&P 500 (SPY). Specifically:
- NMCAX’s ROIC is 4% and below the 36% earned by IUSG and 25% earned by SPY
- NMCAX’s free cash flow yield of 0% is worse than the 1% of IUSG and the 2% of SPY
- the PEBV ratio for NMCAX is 4.5, which is greater than the 2.9 for IUSG and SPY
- our discounted cash flow analysis reveals an average market implied growth appreciation period (GAP) of 59 years for NMCAX’s holdings compared to 27 years for IUSG and 24 years for SPY
In other words, the stocks held by NMCAX generate inferior cash flows and have higher valuations compared to both IUSG and SPY. The market expectations for stocks held by NMCAX imply profit growth (measured by PEBV ratio) that is well above the profit growth expectations embedded in IUSG’s and SPY’s holdings.
Lower historical profits and higher expectations for future profits are a bad combination. Furthermore, in the current market, there is no reason to allocate to overvalued stocks when there are industry leading firms trading at discounted prices.
Strategy Selects Many of the Most Dangerous Stocks
We have featured several of the highly overvalued stocks to which NMCAX allocates as Danger Zone picks: Entegris Inc. (ENTG), Peloton Interactive Inc. (PTON), Spotify (SPOT), and Snap Inc. (SNAP). These companies have poor profitability and competitive disadvantages matched with valuations that imply they will significantly improve profitability and achieve huge market share gains.
NMCAX’s largest holding, Twilio Inc. (TWLO: $352/share) poses particularly large risk for fiduciaries. Twilio has grown revenue from $89 million in 2014 to $1.8 billion in 2020. Economic earnings, which not only account for unusual items on the income statement and balance sheet, declined from -$29 million to -$739 million over the same time, per Figure 4.
Twilio’s ROIC, which remains negative, has improved from -64% in 2014 to -7% in 2020, but the firm has burned through a cumulative $10 billion (17% of market cap) in free cash flow (FCF) since 2015.
Figure 4: Twilio’s Revenue & Economic Earnings Since 2014
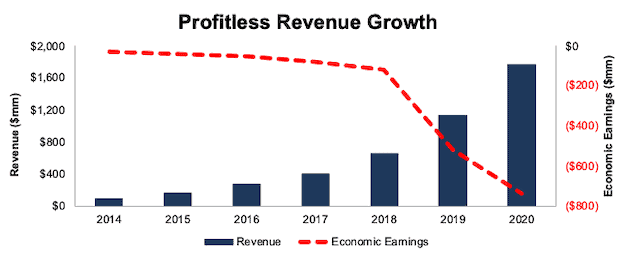
Sources: New Constructs, LLC and company filings
TWLO Is Priced to Take ~43% of Its TAM
Despite the deterioration in Twilio’s fundamentals, shares are up 327% over the past year (vs. S&P +63%) and are significantly overvalued. We use our reverse discounted cash flow (DCF) model to quantify the growth in cash flows, and implied market share, Twilio must achieve to justify its valuation.
To justify its current price of ~$350/share, Twilio must:
- immediately achieve a 14% NOPAT margin (which equals the average NOPAT margin of the 69 profitable Software firms under coverage, compared to Twilio’s -22% NOPAT margin in 2020)
- grow revenue by 34% compounded annually (above consensus estimates of 31% compounded annually over the next five years) for the next decade
See the math behind this reverse DCF scenario. In this scenario, Twilio’s NOPAT would reach $4.6 billion in 2030, which based on 2020 figures, would be higher than the 128 Software firms under coverage except only Microsoft (MSFT), Oracle (ORCL), and SAP (SAP).
In this scenario, Twilio’s revenue would reach nearly $34 billion in 2030, or 43% of its total addressable market (TAM), which is up from 2% of its TAM based on 2020 revenue. See Figure 6.
Figure 5 compares the firm’s implied future NOPAT in this scenario to its historical NOPAT. For context, we include the NOPAT of Adobe (ADBE) and Intuit (INTU), the firms with the fourth and fifth highest NOPAT in the Software industry in 2020. As show in Figure 5, Twilio’s valuation implies its profits will nearly triple that of Intuit, despite Twilio’s NOPAT currently ranking seventh worst in the industry.
Figure 5: Twilio’s Historical NOPAT vs. Implied NOPAT
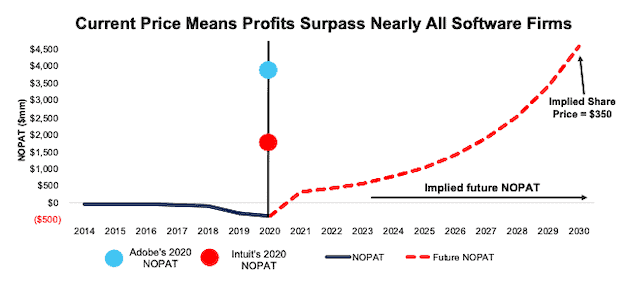
Sources: New Constructs, LLC and company filings.
Twilio’s current valuation implies unrealistic market share gains.
Figure 6: Twilio’s Valuation Implies Huge Increase in Market Share
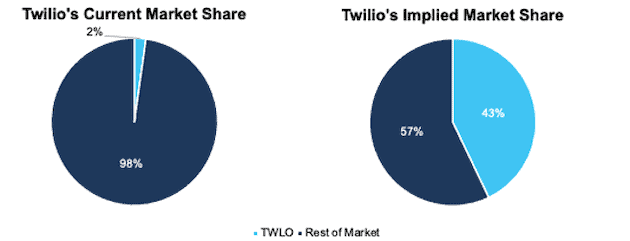
Sources: New Constructs, LLC and company filings.
61% Downside Risk Even if Twilio Becomes Profitable
Twilio’s economic book value, or no growth value, is -$50/share, which further illustrates the overly optimistic expectations implied by its stock price.
Even if we assume Twilio can achieve a 7% NOPAT margin (half the average of profitable Software firms under coverage) and grow revenue by 31% compounded annually for the next decade (which assumes revenue grows at consensus estimates from 2021-2025 and 28% each year thereafter), the stock is worth only $138/share today – a 61% downside to the current stock price. See the math behind this reverse DCF scenario.
In this scenario, Twilio’s NOPAT grows from -$393 million in 2020 to $1.7 billion in 2030. For reference, the firm’s NOPAT fell from -$27 million in 2014 to -$393 million in 2020.
Each of these scenarios also assumes Twilio is able to grow revenue, NOPAT, and FCF without increasing working capital or fixed assets. This assumption is unlikely but allows us to create best-case scenarios that demonstrate how high expectations embedded in the current valuation are.
Style Drift Is an Another Red Flag
Investors that blindly trust fund managers without doing diligence on the fund’s holdings can unknowingly allocate to a different investment style than the fund’s name suggests. Prior research shows that managers drift into other styles to improve their relative ranking from Morningstar and look more attractive to investors.
Morningstar classifies NMCAX (and other share classes) as a Mid Cap Growth fund. Mid Cap is commonly defined as companies with market capitalizations between $2 billion and $10 billion. However, the weighted-average market cap of NMCAX’s holdings is $29 billion and its top 10 holdings have market capitalizations ranging from $11.2 billion to $65.9 billion. Its smallest holding has a market cap of just $4.2 billion. Accordingly, NMCAX should be classified as an All Cap Growth fund.
Without holdings analysis, investors in NMCAX think they’re getting exposure to Mid Cap stocks, when in reality the size of firms skews much larger.
Excessive Fees Make Outperformance Even More Difficult
At 3.85%, NMCAX’s total annual costs (TAC) are higher than 97% of the 476 All Cap Growth mutual funds under coverage. For comparison, the average TAC of all All-Cap Growth mutual funds under coverage is 1.68%, the weighted-average is 1.45%, and the benchmark ETF (IUSG) has total annual costs of 0.04%.
Our TAC metric accounts for more than just the expense ratio. We consider the impact of front-end loads, back-end loads, redemption fees, and transaction costs. For example, NMCAX’s front-end load adds 2.19% to its total annual costs, and its annual turnover ratio of 92% adds 0.2% to its total annual costs – neither of which are captured by the expense ratio. Figure 7 shows our breakdown of NMCAX’s total annual costs, which we provide for all of the ~7,000 mutual funds under coverage.
Figure 7: Voya Mid Cap Opportunities Fund Total Annual Costs Breakdown
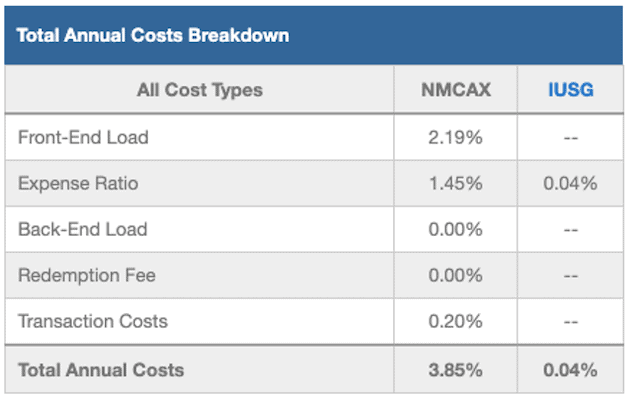
Sources: New Constructs, LLC and company, ETF and mutual fund filings
To justify its higher fees, each class of the fund must outperform its benchmark by the following amounts over three years:
- NMCAX must outperform by an average of 3.8% annually.
- NMCCX must outperform by an average of 2.4% annually.
- IMORX must outperform by an average of 1.9% annually.
- IMOWX must outperform by an average of 1.3% annually.
- NMCIX must outperform by an average of 1.2% annually.
- IMOZX must outperform by an average of 1.1% annually.
Get a copy of our standard mutual fund report on NMCAX.
The Importance of Holdings-Based Fund Analysis
Smart fund (or ETF) investing means analyzing the holdings of each mutual fund. Failure to do so is a failure to perform proper due diligence. Simply buying a mutual fund or ETF based on past performance does not necessarily lead to outperformance. Similarly, blindly diversifying through index funds is no substitute for diligence. Only through holdings-based analysis can one determine if a fund’s methodology leads managers to pick high-quality or low-quality stocks.
However, most investors don’t realize they can access sophisticated fundamental research[3] using data that enables investors to overcome inaccuracies, omissions, and biases in legacy fundamental datasets. Our Robo-Analyst technology analyzes the holdings of all 506 ETFs and mutual funds in the All Cap Growth and ~7,600 ETFs and mutual funds under coverage to avoid “the danger within.” This diligence allows us to cut through the noise and identify potentially dangerous funds that traditional, backward-looking fund research may overlook, such as NMCAX.
Our clients can directly leverage holdings-based analysis and create their own All Cap fund while avoiding the management fees that NMCAX and other mutual funds charge.
Better-Rated All Cap Growth Funds
The following are two All Cap Growth mutual funds that earn an Attractive-or-better rating, have more than $100 million in assets under management, and have below average TAC.
- Evercore Equity Fund (EWMCX) - 1.15% TAC
- Nicholas Fund, Inc. (NICSX) - 0.83% TAC
This article originally published on March 22, 2021.
Disclosure: David Trainer, Kyle Guske II, Alex Sword, and Matt Shuler receive no compensation to write about any specific stock, sector, style, or theme.
Follow us on Twitter, Facebook, LinkedIn, and StockTwits for real-time alerts on all our research.
[1] Three independent studies prove the superiority of our data, models, and ratings. Learn more here.
[2] Core Earnings are a superior measure of profits, as demonstrated in Core Earnings: New Data & Evidence, a paper by professors at Harvard Business School (HBS) & MIT Sloan. Recently accepted by the Journal of Financial Economics, the paper proves that our data is superior to all the metrics offered elsewhere.
[3] See how our models overcome flaws in Bloomberg and Capital IQ’s (SPGI) analytics in the detailed appendix of this paper.