
Check out this week’s Danger Zone interview with Chuck Jaffe of Money Life and Marketwatch.com
From non-GAAP accounting to costly acquisitions, it is not difficult for a company to create the illusion of profits. However, eventually reality sets in and the deterioration of a business comes to light. This week’s Danger Zone pick, Textron Inc. (TXT: $42/share), is destroying shareholder value while covering it up with an acquisition that creates the illusion of profits via GAAP net income growth. The momentum behind this stock will reverse when investors realize this acquisition is not delivering and the business has been in a long-term decline.
GAAP Income Doesn’t Tell The True Story
From 2013 to the trailing-twelve-months (TTM), Textron’s GAAP net income has grown from $498 million to $666 million. Over the same timeframe, the company’s economic earnings, or true earnings available to equity shareholders, have declined from -$422 million to -$677 million. This discrepancy can be seen in Figure 1.
Figure 1: GAAP Net Income Illusion
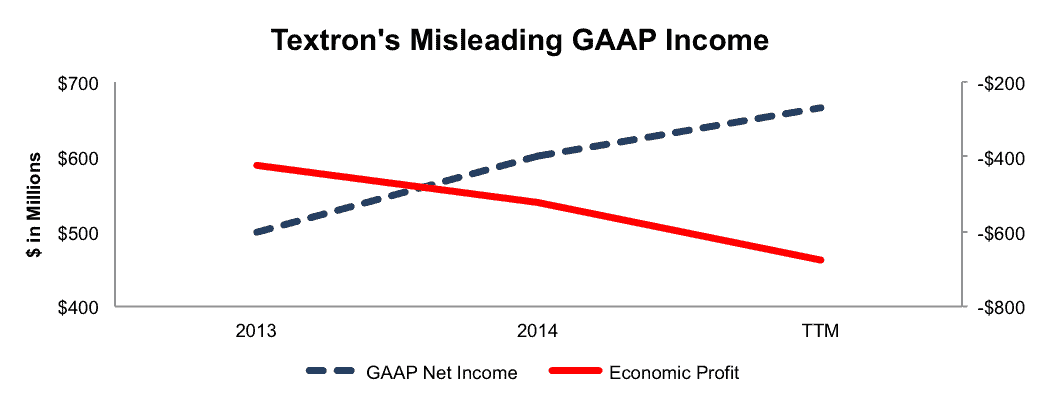
Sources: New Constructs, LLC and company filings
Unfortunately for investors, Textron has failed to earn positive economic earnings in any year in our model, which dates back to 1998. Through the use of accounting loopholes and the shortcomings of GAAP, Textron has been able to present itself as a profitable business despite destroying value the entire way.
The problem with using GAAP net income is that it overlooks almost the entire balance sheet. In 2014, the cost of capital that Textron needs to run its business totaled $1.2 billion, or $4.29/share. After removing this cost from reported earnings we see that Textron’s economic EPS were -$1.87 compared to GAAP EPS of $2.13 for 2014.
What investors need to realize is that, despite what GAAP numbers are showing, Textron’s numerous business lines have not been able to recover from the economic crisis in 2008. In that year, Textron earned a return on invested capital (ROIC) of 8%, which has since fallen to a bottom quintile 4% in the TTM. Additionally, Textron’s 7% NOPAT margin in 2008 has fallen to 4% over the TTM. With misleading earnings and a deteriorating business, it’s clear to see why Textron finds itself on November’s Most Dangerous Stocks list.
Textron’s Profitability Lags Competitors
Figure 2 shows that Textron’s 4% ROIC is much lower than that of its numerous competitors. Because Textron operates as an industrial conglomerate making airplanes, helicopters, golf carts, and automobile parts, it faces competition from a multitude of industries. However many of these competitors operate much more profitably that Textron. This lack of profitability creates a competitive disadvantage, especially when it comes to the stiff pricing competition the company faces.
Figure 2: Textron’s Lagging ROIC

Sources: New Constructs, LLC and company filings
Bull Case Ignores Declining Businesses
Many TXT bulls appear stuck in the mindset that the company can return to its pre-recession “glory-days.” However, not only was this time not as rosy as it may have seemed, as shown by Textron’s consistently negative economic earnings, there simply isn’t the demand there once was for Textron’s multiple products. Through 3Q15, Textron generated 35% of revenues from its Aviation business segment, which includes all its airplane operations. Unfortunately for bulls who believe the company can significantly grow this segment, long-term global spending in the business jet market is starting to slow for the first time since 2009. In fact, Honeywell expects shipments over the next decade to decline nearly 4% from the prior decade.
Further compounding bull arguments are that the issues with Textron are not only in its Aviation segment. The companies helicopter division, or Bell segment is not faring any better. The Bell segment represented 25% of revenues through 3Q15, however revenues are down 24% from the first nine months of 2014. Essentially two-thirds of Textron’s revenues are in industries projected to be in a long-term decline, or are already showing signs of decline. Meanwhile, the company’s share price would imply quite the opposite, as we’ll show below.
Acquisition Destroys Shareholder Value Despite Showing EPS Growth
If we assume that Beech Holdings, LLC, acquired for $1.4 billion in March 2014, has margins equal to Textron’s NOPAT margin, the deal only provides a 5% ROIC, which is below the 6% ROIC Textron earned in 2013 and its current weighted average cost of capital (WACC) of 8.58%. In other words, despite showing EPS growth post acquisition, the deal destroyed value. This acquisition is another excellent example of the high low fallacy.
Valuation Showing Large Downside Risk
Year-to-date Textron’s stock price is relatively flat and has traded in-line with the market. However, shares could have significant downside given just how lofty the expectations built into the stock price have become. To justify its current price of $42/share, Textron must grow NOPAT by 11% compounded annually for the next 16 years. This expectation seems rather optimistic given that over the past 16 years Textron has only managed to grow NOPAT by 1% compounded annually. Even worse, NOPAT has declined by 2% compounded annually over the past three years.
Even if we believe the bull case and assume Textron can increase its historical profit growth six fold and grow NOPAT by 6% compounded annually for the next decade, the stock is only worth $21/share today – a 50% downside.
Buyout Seems Unlikely
With highly diversified business operations, it would seem unlikely that a firm would acquire Textron. Not only would the acquirer have to be able to manage operations ranging from airplanes/helicopters, defense systems, automobiles, and even lawn maintenance equipment, doing so would be extremely costly. Additionally, Textron’s acquisition of Beechcraft has only made a buyout more unattractive. The company’s TTM debt of $3.4 billion (29% of market cap), which includes $332 million in off balance sheet operating leases, has increased significantly from $2.4 billion in 2013. Unfortunately, the reason for this large debt increase, the acquisition of Beechcraft, has only resulted in a decline in profits and ROIC. Any potential suitor for Textron would now have to incur a greater debt load for a combined company that is less profitable than it was just two years ago. If any firm were interested in buying Textron, it would be wise to wait for the share price to fall to more realistic levels.
Catalyst: When Mirage of EPS Growth Fades
Struggling clothing retailer Men’s Wearhouse (MW) recently fell over 40% in one day as its quarterly earnings disappointed investors. How is this relevant to Textron you may ask? When we put Men’s Wearhouse in the Danger Zone, we noted that its acquisition of Joseph A. Bank could only mask the troubles at the company for so long, and eventually the deterioration of the business would reveal itself. We believe a similar situation could occur in regards to Textron. As revenues began to decline, Textron acquired Beechcraft in mid 2014, which helped prop up 2014 results, in the form of another year of EPS growth. However, as we have shown above, this acquisition has left the company less profitable and more debt laden, not exactly the characteristics of a quality acquisition. When yearly results are reported and the costs of the Beechcraft acquisition are revealed (much like Men’s Wearhouse), investors could flee in mass. Couple in the slowing jet market and overall sluggish economy and TXT is certainly not a stock we would want to own.
Insider Sales and Short Interest Remain Low
Over the past 12 months 95,000 shares have been purchased and 74,000 shares have been sold for a net effect of 21,000 insider shares purchased. These sales represent <1% of shares outstanding. Additionally, there are 5.5 million shares sold short, or 2% of shares outstanding.
Executive Compensation Is Misguided
Executives at Textron receive base salaries and short and long-term incentive pay in the form of stock units and bonuses. Textron’s short term incentives are based upon meeting a target “segment profit” and manufacturing cash flow. Unfortunately these are non-GAAP measures, which should immediately raise alarms. In fact, Textron’s segment profit removes acquisition and restructuring costs, yet in 2014, Textron acquired Beechcraft for $1.4 billion. Quite convenient to tout revenue and GAAP EPS growth through acquisition and then remove the expenses of that acquisition when it comes time to determine bonuses. Additionally, manufacturing cash flow is determined before pension contributions; pensions that just so happen to be underfunded by $1.4 billion. No matter which way you look at it, Textron’s use of non-GAAP metrics to determine compensation serves executives’ best interests at the expense of shareholders.
Impact of Footnotes Adjustments and Forensic Accounting
We have made several adjustments to Textron’s 2014 10-K. The adjustments are:
Income Statement: we made $1 billion adjustments with a net effect of removing $87 (<1% of revenue) million in non-operating expenses. We removed $478 million in non-operating income and $565 million in non-operating expenses.
Balance Sheet: we made $6.3 billion of balance sheet adjustments to calculate invested capital with a net increase of $3.5 billion. The largest adjustment was the inclusion of $1.6 billion related to asset write-downs. This adjustment represented 16% of reported net assets.
Valuation: we made $4.9 billion of shareholder value decreasing adjustments. There were no value increasing adjustments. The most notable adjustment to shareholder value was the removal of $1.4 billion due to underfunded pensions. This adjustment represented 12% of Textron’s market cap.
Dangerous Funds That Hold TXT
The following fund receives our Dangerous rating and allocates significantly to Textron.
- Northern Lights Beech Hill Total Return Fund (BHTAX) – 3.4% allocation and Dangerous rating.
- Investment Managers Series Trust BearlyBulish Fund (BRBLX) – 2.1% allocation and Dangerous rating.
- Fidelity Advisor Industrials Fund (FCLAX) – 2.0% allocation and Dangerous rating.
Disclosure: David Trainer and Kyle Guske II receive no compensation to write about any specific stock, style, or theme.
Click here to download a PDF of this report.
Photo Credit: Airwolfhound (Flickr)